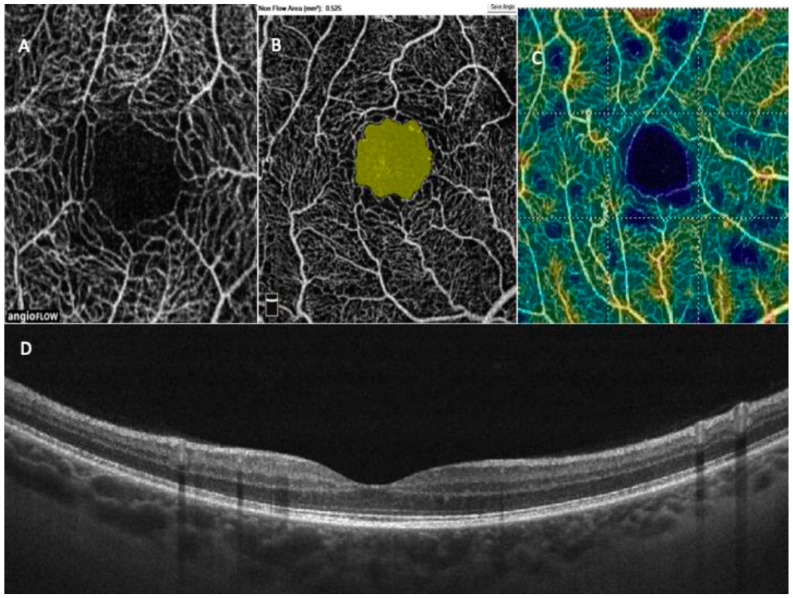
Figure 2.
Representative OCT and OCTA images of a child with T1D. (A)—superficial retinal plexus with an enlarged FAZ area in the center (scan 3 × 3 mm); (B)—automatic measurement of FAZ area (yellow)—the result is visible in the upper left corner (mm2); (C)—superficial vessel density map—navy blue areas represent non-perfusion zones; (D)—OCT B-scan of normal retina, without symptoms of DR.

