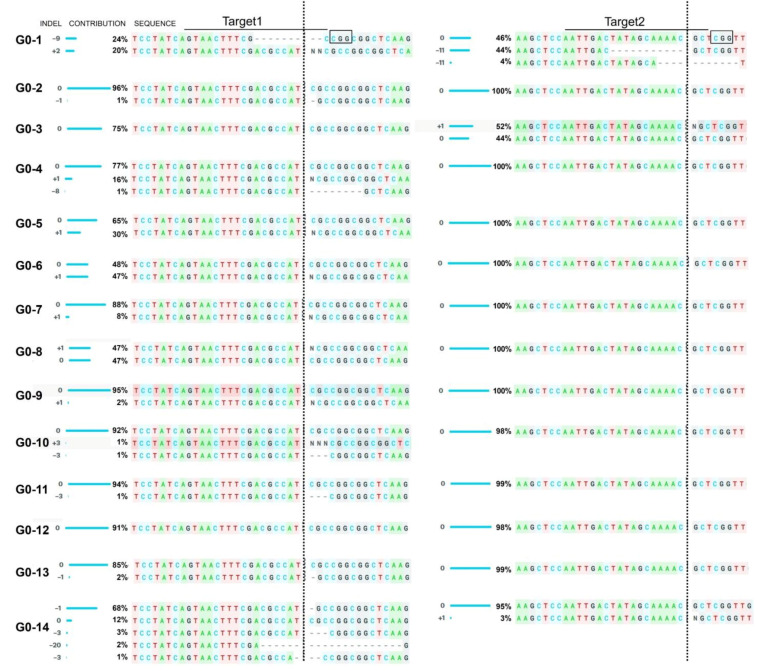
Figure 4.
ICE analysis with amplified PCR fragments from slsrfr1 G0 plants. PCR fragments were amplified using genomic DNA isolated from slsrfr1 G0 plants, and the sequences were analyzed by ICE analysis with Sanger sequencing results. The ICE analysis represents the indel pattern in each target sequence of guide RNA, the contribution of each edited pattern, and the genome-edited sequences. Black box indicates the PAM site and the target sequences of guide RNAs are overlined. The ICE contribution values may not add up to 100% based on Sanger sequencing data of a specific sample, because the remaining percent of the decomposed data does not fit in predicted outcomes by ICE program. Vertical stippled lines represent cleavage site by SpCas9 for each sgRNA target. The analyzed sequences are shown in 3’-to-5’ direction through ICE analysis with Sanger sequencing results.

