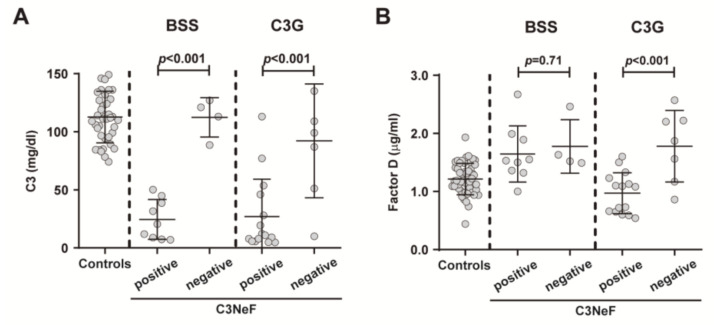
Figure 6.
Differences in C3 and FD plasma levels in patients with Barraquer–Simons syndrome (BSS) and patients with C3 glomerulopathy (C3G). C3 (A) and FD (B) levels were analyzed in the BSS and C3G cohorts according to the presence of C3 nephritic factor (C3NeF). The results are represented as medians and interquartile ranges. p < 0.05 was considered to be statistically significant.

