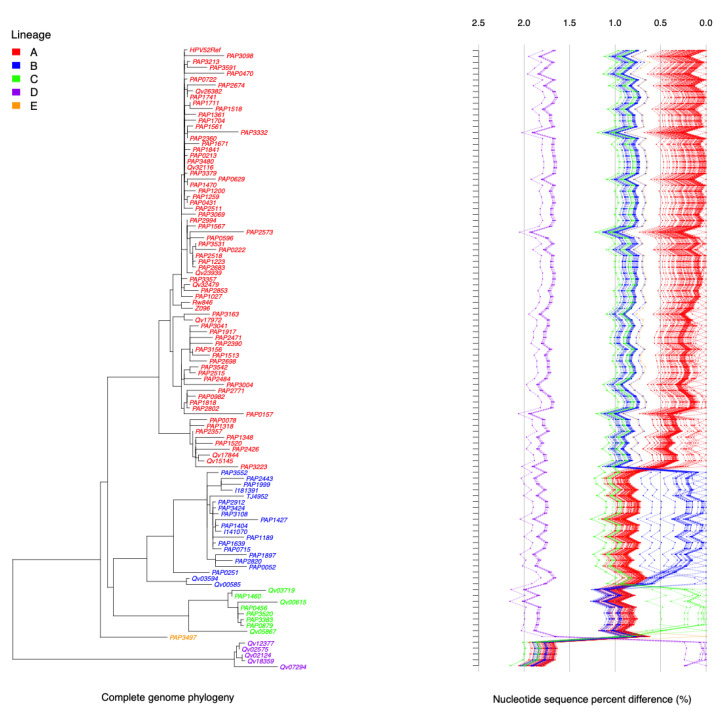
Figure 2.
HPV52 phylogenetic tree topology and pairwise comparisons of individual complete genomes. The phylogenetic tree was inferred from global alignment of the complete nucleotide sequences from 106 HPV52 genomes. Distinct variant lineages (A, B, C, D, and E) were classified according to the topology and nucleotide sequence differences from >1% to <10% and are represented according to the color code shown at the top left of the figure. The percent nucleotide differences for each isolate compared to all other isolates are shown on the right. Lines indicate values for each comparison of a given isolate with the comparison to self as indicated by the 0% difference point to the far right.

