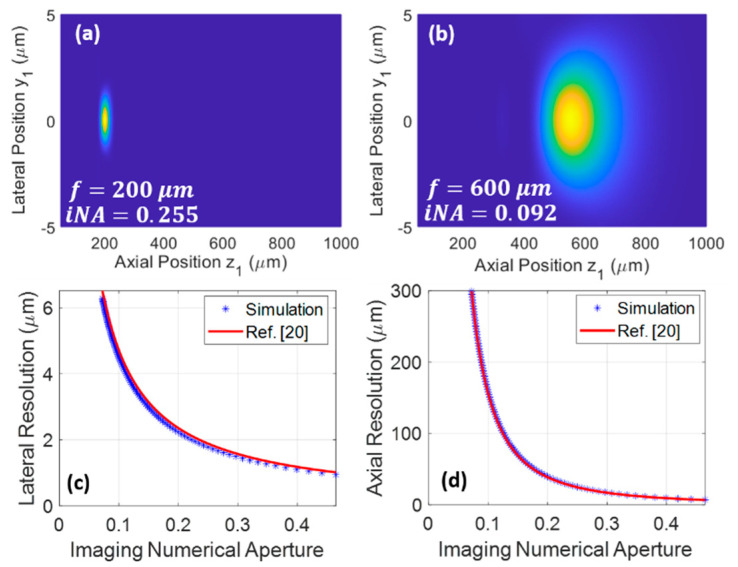
Figure 6.
Simulated resolution. Distribution of when (a) and (b). Calculated lateral (c) and axial (d) resolution vs. imaging numerical aperture (). Here, resolution is defined by the 1/e full width of the signal intensity (i.e., ) fitted to a Gaussian function. Simulation parameters are the same as those in Figure 2, except (equal to 90 times average minus 1 mm).

