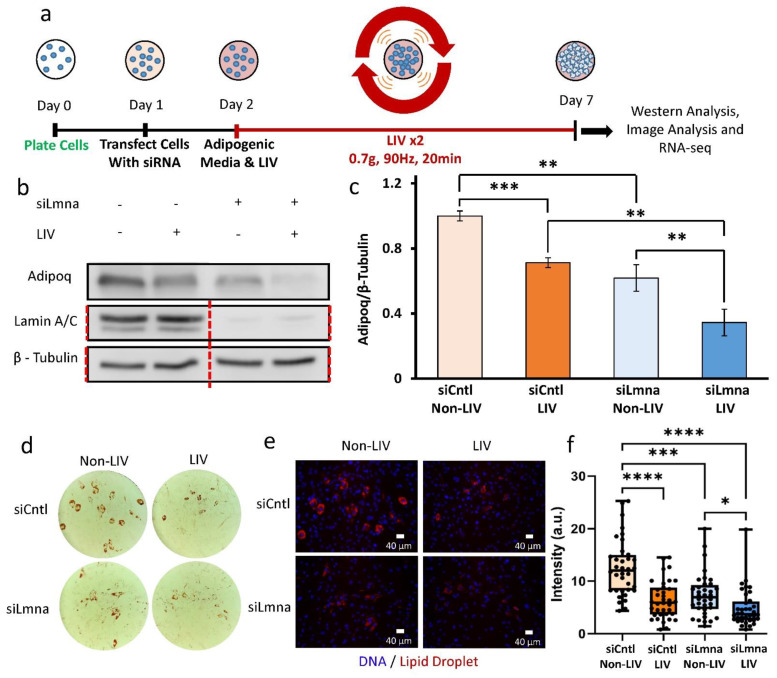
Figure 4.
Application of daily LIV treatment decreases adipogenic differentiation in MSCs: (a) On day 0 cells were plated. Then, on day 1 cells were transfected with siRNA. On day 2 adipogenic media was placed on cells and cells were treated with LIV for 20 min, twice daily. Once cells differentiated, cells were pulled off for western analysis, image analysis, and RNA-seq. (b) Representative western blots of cells treated with siCntl and siLmna after 7 days of adipogenic induction with and without LIV treatment. Adiponectin (Adipoq), lamin A/C, and β-Tubulin were targeted. Lamin A/C and β-Tubulin were imaged on the same plot. Red line represents western blot cropped for alignment; uncropped blots were provided in Figure S4. (c) Relative levels of adiponectin of the siCntl and the siLmna groups. Adipoq levels in iLmna treated MSCs with no LIV were decreased by 39% (p < 0.01, n = 4) compared to siCntl MSCs with no LIV. LIV treated samples had 30% reduction in Adipoq levels compared to non-LIV controls for siCntl treated cells (p < 0.001, n = 3/grp). siLmna treated cells treated with LIV had a reduction of Adipoq levels of 44% compared to non-LIV samples (p < 0.01, n = 3/grp). siLmna cells treated with LIV compared to siCntl cells with LIV treatment had a 51% reduction in Adipoq (p < 0.01, n = 3/grp). (d) Representative Oil-Red-O images. (e) Representative images of lipid droplet staining corresponding to Oil-Red-O images Scale bars: 40 µm. (f) Analysis of the mean lipid droplet intensity per cell. LIV treated siCntl cells experienced a decrease of lipid droplet mean intensity by 49% (n = 36, p < 0.0001). siLmna cells treated with LIV had a decrease of 44% compared to non-LIV siLmna samples. (n = 36, p < 0.05). siLmna non-LIV samples had 42% less mean intensity compared to siCntl non-LIV samples (n = 36, p < 0.001). Western results are presented as mean ± STE. Western group comparisons were made via parametric two-tailed Student t-test. Lipid droplet group comparisons were made with Kruskal-Wallis Test. * p < 0.05, ** p < 0.01, *** p < 0.001, **** p < 0.0001, against control.

