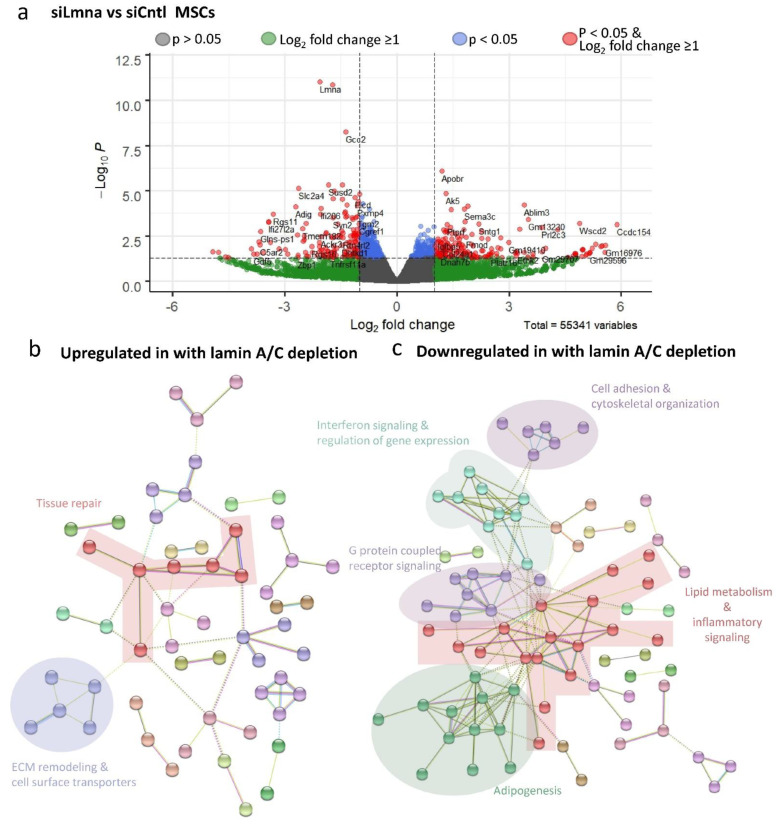
Figure 6.
Lamin A/C depletion impedes adipogenic transcription in MSCs: (a) Volcano plot of siLmna compared to siCntl under adipogenic conditions. Genes with Wald values greater than p value of 0.05 are colored in grey. Genes with differential gene expression equal to or larger than 2-fold ( = 1) but have Wald values greater than p value of 0.05 are colored in green. Genes colored with blue have Wald values smaller than p value of 0.05, but differential gene expression less than 2-fold ( = 1). Genes with Wald values smaller than p value of 0.05 and differential gene expression equal to or larger than 2-fold ( = 1) are colored in red. Grouping of five or more associated genes were highlighted and subsequently subjected to a supervised analysis of biologic function. (b) Upregulated genes were associated with cellular processes included tissue repair, ECM remodeling and cell surface transporters. (c) Downregulated gene groups included, cell adhesion and cytoskeletal organization, interferon signaling and regulation of gene expression, G-protein coupled receptor signaling, lipid metabolism and paracrine inflammatory signaling and adipogenic phenotype.

