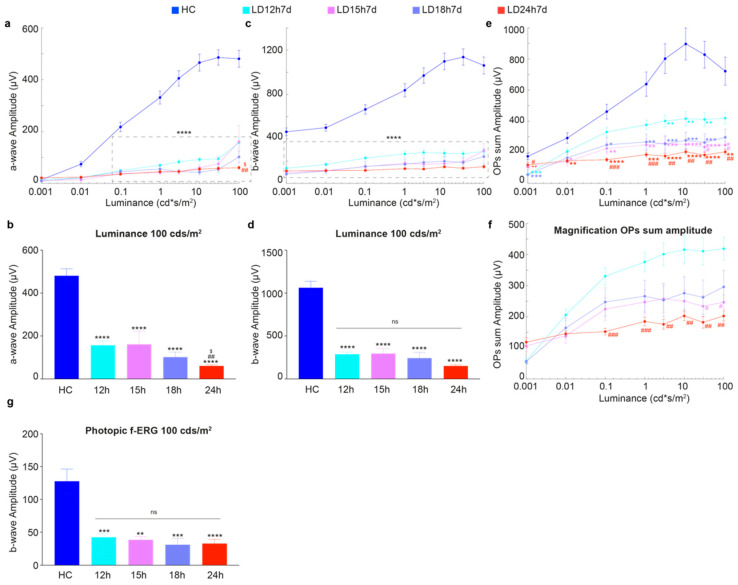
Figure 1.
Retinal functional impairment following different durations of light exposure. (a,c) Amplitudes of the a-wave and b-wave in healthy control (HC) and different experimental groups (LD12h7d, LD15h7d, LD18h7d, and LD24h7d) are plotted as functions of stimulus intensity (0.001–100 cd*s/m2). A-wave amplitude in the HC was significantly higher than all groups exposed to light for all luminances brighter than 0.1 cd*s/m2. B-wave amplitude was significantly higher than all experimental groups at all luminances. (b,d) Panels b and d represent a-wave and b-wave amplitudes measured at 100 cd*s/m2. LD24h7d a-wave amplitude at 100 cd*s/m2 was significantly reduced compared to LD12h7d. ## p = 0.0011, and LD15h7d, $ p = 0.0177; two-way ANOVA with Tukey’s post hoc test. (e) Amplitudes of the OPs sum in HC and different experimental groups are plotted as functions of stimulus intensity (0.001–100 cd*s/m2). On average, OPs sum amplitudes were significantly affected by all durations of light exposure. (f) Panel f represents a large magnification of panel (e). The effect of light exposure was milder after 12 h; indeed, OP amplitude was significantly preserved in LD12h7d vs. LD24h7d at intensities brighter than 0.1 cd*s/m2. (g) The values represent the mean response amplitudes of photopic b-waves. Statistical significance is represented as follows: *, #, $ p ≤ 0.05, **, ##, ++ p ≤ 0.01, ***, ### p ≤ 0.001, **** p ≤ 0.0001; *, #, $, + are in comparison to HC, LD12h7d, LD15h7d, and LD18h7d, respectively; two-way and one-way ANOVA with Tukey’s post hoc test were used to assess differences in the panels (a–g), respectively. Values represent means ± standard errors of the means (SEM). Between 6 and 12 retinas were recorded per group.

