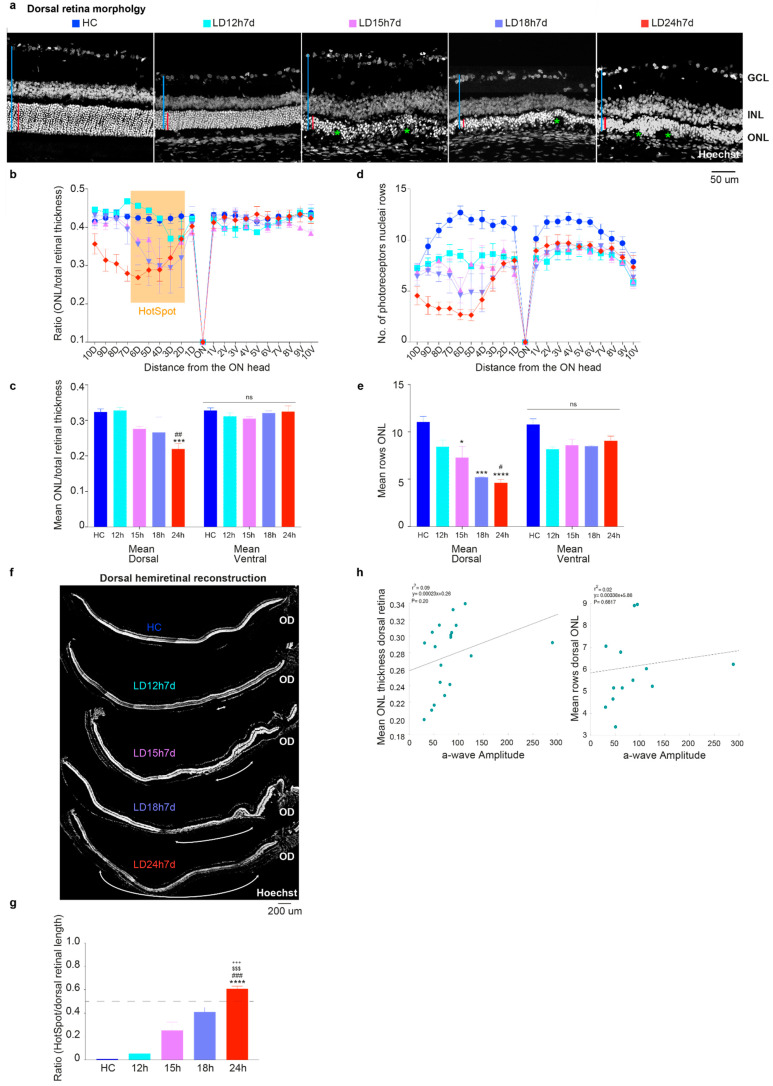
Figure 2.
Morphometric evaluation of the light damage resulting from different exposure times. (a) Photomicrographs of the hot spot in the dorsal central retina of an undamaged control rat (HC) and rats exposed to 12 h, 15 h, 18 h, and 24 h of constant light; nuclei are stained with Hoechst. The red bars show the absolute thickness of the ONL, and the blue one the entire retinal thickness. Scale bar = 50 µm. Green asterisks signify disruptions in the ONL. Abbreviations: GCL: ganglion cell layer; INL: inner nuclear layer; ONL: outer nuclear layer. (b,d) ONL thickness and number of rows of photoreceptor nuclei (±SEM) quantified in 20 equidistant retinal locations (10 dorsal, 10 ventral). (c,e) Average across all dorsal or ventral retinal locations of the ONL thickness (ratio ONL/total retinal thickness) and the number of photoreceptor nuclei rows. (f) Representative dorsal hemiretina reconstruction after nuclei staining. The white arrows depict the damage extensions defined as “hot spots” on light damaged retinas. Scale bar = 200 µm. OD: optic disc. (g) Damaged ONL length/dorsal retina length for different light damage durations. (h) Relationship between a-wave amplitudes and ONL thickness/rows (Pearson correlation). Data in all graphs are shown as mean ± standard error of the mean (SEM). Statistically significant differences are represented as follows: *, # p ≤ 0.05, ## p ≤ 0.01, ***, ###, $$$, +++ p ≤ 0.001, **** p ≤ 0.0001; *, #, $, + compared to HC, LD12h7d, LD15h7d, and LD18h7d, respectively; one-way ANOVA with Tukey’s post hoc test. N = 3/12 retinas from different rats for each experimental condition.

