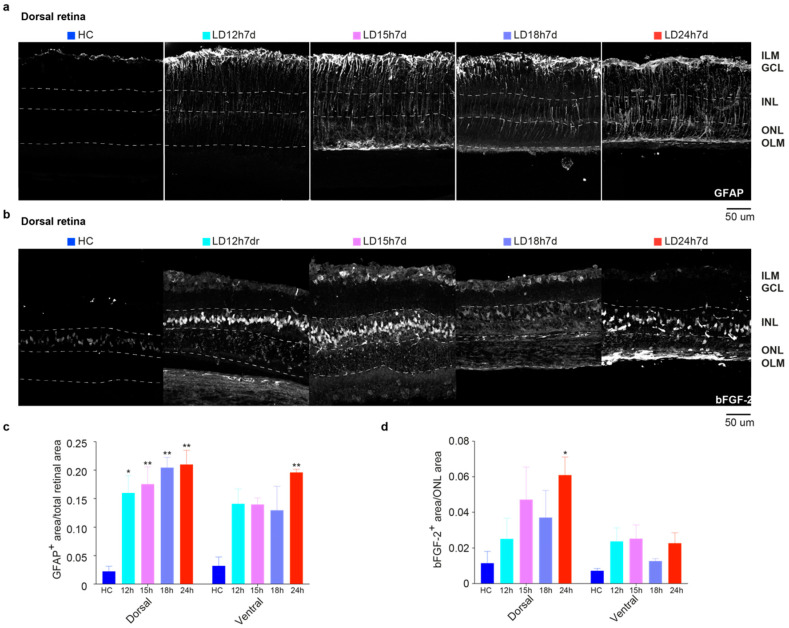
Figure 3.
GFAP and bFGF-2 expression in retinas of rats exposed to light for different durations of time. (a) Representative photomicrographs illustrating GFAP+ astrocytes in dorsal retinal sections of HC and 7 days after 12 h, 15 h, 18 h, and 24 h of light damage (in the area around the degenerating hot spot, defined “penumbra” [41]), respectively. Light exposure induced the upregulation of GFAP in the radially oriented Müller cells; the protein was visible along the full length of the Müller cells, from the ILM to the OLM. (b) Representative photomicrographs illustrating bFGF-2+ signal in the dorsal retinal areas of control and light-exposed rats. Light exposure induced the upregulation of bFGF-2, released in the ONL by Müller cells; the protein is visible around photoreceptor bodies in the ONL and Müller cell bodies in the INL. Abbreviations: GCL: ganglion cell layer; INL: inner nuclear layer; ONL: outer nuclear layer; ILM: inner limiting membrane; OLM: outer limiting membrane. Scale bar = 50 μm. (c) Mean GFAP+ area averaged across dorsal and ventral retinal selected areas. (d) Mean bFGF+ area/ONL area averaged across the dorsal and ventral retina. Statistical analyses were performed with the analysis of variance (one-way ANOVA) followed by a Tukey’s post hoc test; one-way ANOVA with Trend was also used to analyze data in panel d. Statistically significant differences are represented as follows: * p ≤ 0.05, ** p ≤ 0.01, respectively, compared to HC. Data are shown as the means ± SEM of at least N = 3 retinas from different rats for each experimental condition.

