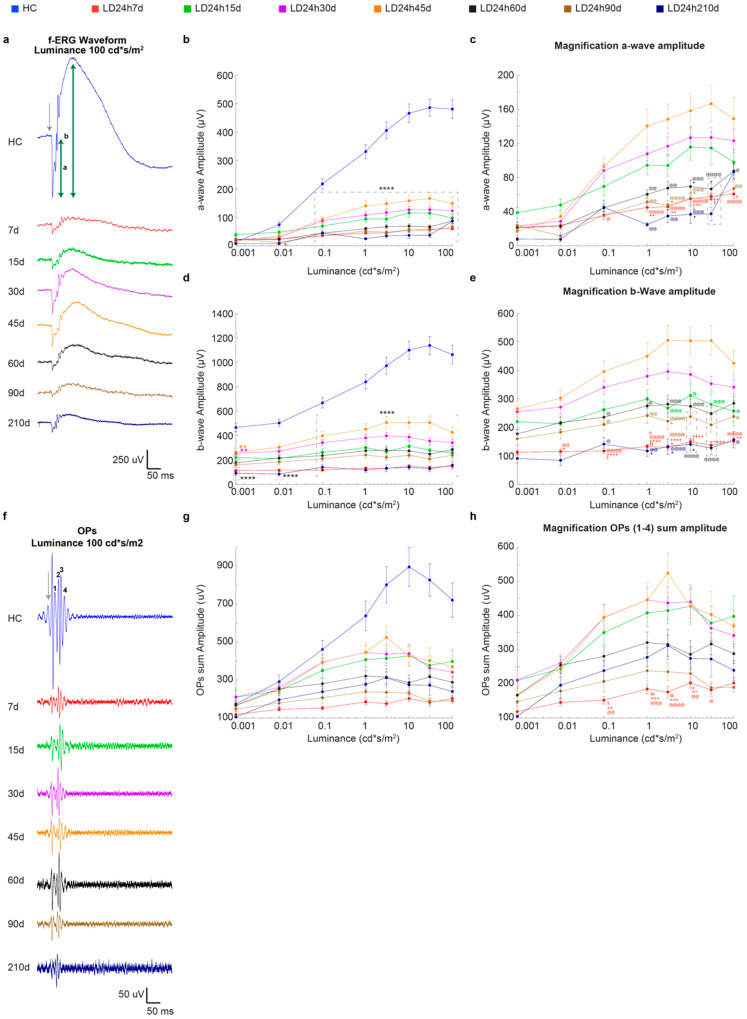
Figure 5.
In vivo functional assessment at different recovery times following 24 h of light exposure. (a) Representative fERG waveforms in response to 100 cd*s/m2 flash intensity obtained from control and all experimental groups (7, 15, 30, 45, 60, 90, and 210 days following the end of light exposure). Calibration: horizontal 50 ms, vertical 250 μV. The grey arrow indicates when the flash stimulus was sent. (b,d) Amplitudes of the a-wave and b-wave in HC (blue line) and different experimental groups as a function of stimulus intensity (0.001–100 cd*s/m2). (c,e) represent magnifications of the graphs in (b,d). (f) Representative OP waveforms, isolated by bandpass filtering the dark-adapted ERGs to bright light (100 cd*s/m2), from HC and all experimental groups (7, 15, 30, 45, 60, 90, and 210 days following the end of light exposure). Calibration: horizontal 50 ms, vertical 50 μV. The grey arrow indicates when the flash stimulus was sent. 1–4 depict, respectively, OP1–4, whose amplitude was summed. (g) Amplitudes of the OP sum in HC (blue line) and different experimental groups as a function of stimulus intensity (0.001–100 cd*s/m2). (h) represents a magnification of the graph in panel (g). A single value represents the mean ± standard error of the mean (SEM). Statistical significance is represented as follows: *, $, +, @, & p ≤ 0.05, **, $$, ++, @@ p ≤ 0.01, +++, @@@ p ≤ 0.001, ****, ++++, @@@@ p ≤ 0.0001; *, $, +, @, & represent comparisons with HC, LD24h15d, LD24h30d, LD24h45d, and LD24h60d, respectively; two-way ANOVA with Tukey’s post hoc test. The control group was significantly higher than all light damaged groups at all intensities higher apart 0.001 cd*s/m2 (only statistical results vs. HC are shown in (b,d,g); differences between light-exposed groups are shown in (c,e,f)). N = 15/30 recorded retinas per group.

