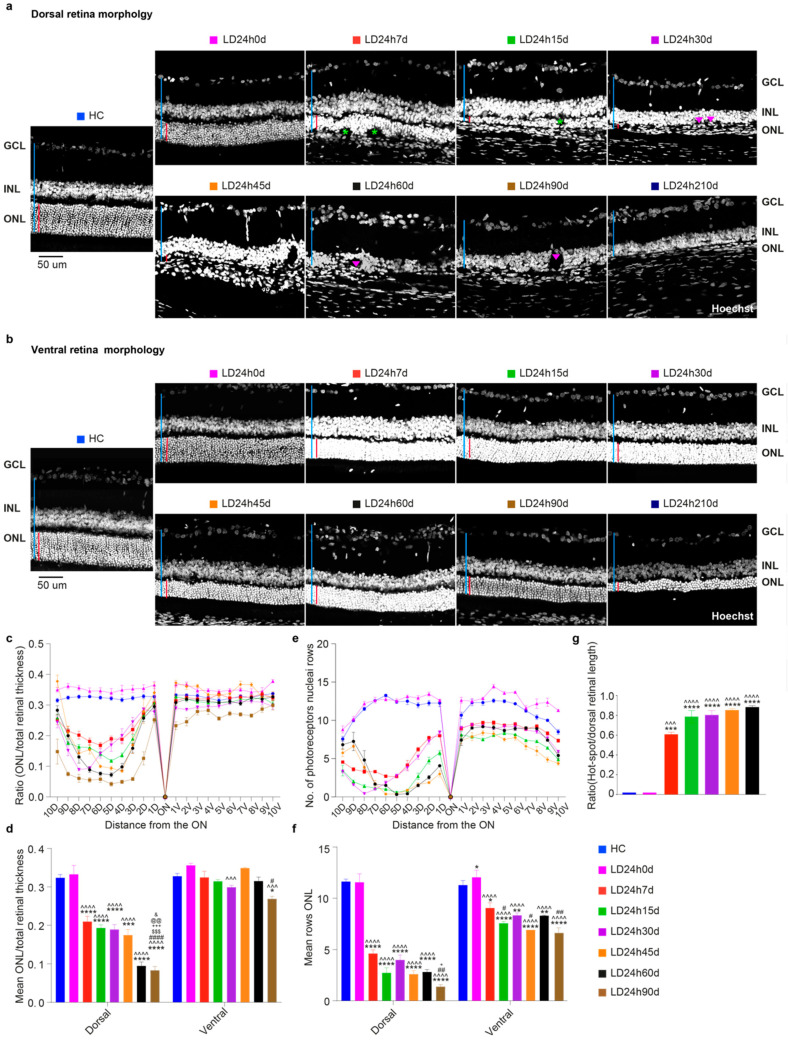
Figure 7.
Morphological alterations were assessed at different recovery times following 24 h of light damage. (a,b) Representative Hoechst-stained retinal cross-sections from the dorsal and ventral central retina. Light damage was more severe in the dorsal retina, considering the matrix disorganization. Abbreviations: GCL: ganglion cell layer; INL: inner nuclear layer; ONL: outer nuclear layer. The red and blue vertical bars show the absolute thickness of the ONL and total retinal thickness, respectively. Green asterisks mark the rosette structures in the ONL, and pink triangles the holes in the INL. Scale bar = 50 μm. (c,e) Graphs showing the ONL thickness and number of photoreceptor nuclei rows (±SEM) in the ONL in 20 equidistant retinal locations (10 dorsal, 10 ventral). (d,f) The average and standard error of ONL thickness (ratio ONL/total retinal length) and numbers of photoreceptor rows. Photoreceptor loss (cell rows) in the retina was significant after 7 days of recovery and progressed for up to 7 months (210 days are not shown on the graph because it was hard to quantify these two parameters because of the tissue’s damage). (g) Damaged ONL length analyses for different recovery times. The extension of the damaged area significantly increased over time, never reaching the retina’s ventral side. Histograms show means ± SEM. Statistical significance is represented as follows: *, #, &, + p ≤ 0.05, **, ##, @@ p ≤ 0.01, ***, ^^^, $$$, +++ p ≤ 0.001, ****, ^^^^, #### p ≤ 0.0001; *, ^, #, $, +, @, & refer to HC, LD24h0d, LD24h7d, LD24h15d, LD24h30d, LD24h45d, and LD24h60d, respectively; one-way ANOVA with Tukey’s post hoc test. Values represent the means ± standard error of the mean (SEM) for at least N = 5 retinas from different rats for each experimental condition.

