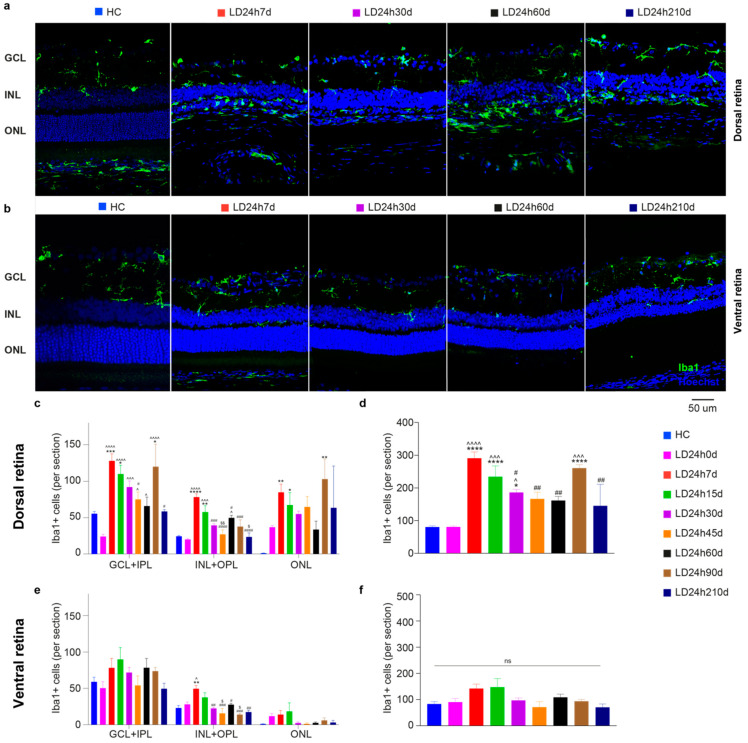
Figure 11.
Quantification of microglia cells at different recovery times after 24 h of light exposure. (a,b) Representative photomicrographs illustrating Iba1+ cells in dorsal retinal sections (hot spot) of control and light-damaged retinas after light exposure. Light damage increased numbers of Iba1+ cells in the ONL by 7 d in the dorsal retina. Abbreviations: GCL: ganglion cell layer; INL: inner nuclear layer; ONL: outer nuclear layer. Scale bar = 50 µm. (c–f) Total numbers of microglia in the dorsal and ventral retina in each retinal layer (c,e) and summed across the entire retinal thickness (d,f). Statistical significance is represented as follows: *, ^, #, $ p ≤ 0.05, **, ##, $$ p ≤ 0.01, ***, ^^^, ### p ≤ 0.001, ****, ^^^^, #### p ≤ 0.0001; *, ^, #, $ refer to HC, LD24h0d, LD24h7d, LD24h15d, respectively; one-way ANOVA with Tukey’s post hoc test. Data are shown as mean ± SEM of at least N = 5 retinas from different rats for each experimental condition.

