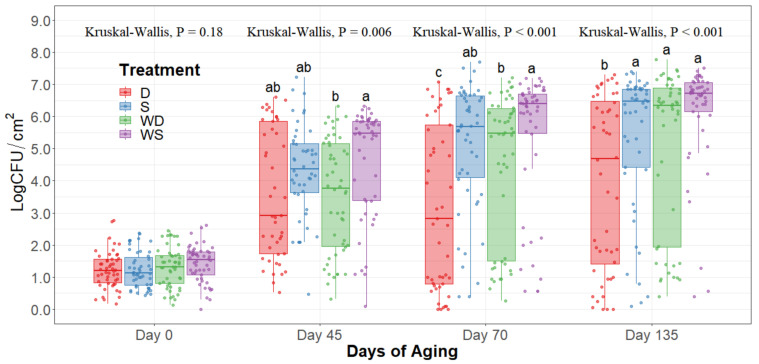
Figure 3.
Aerobic plate counts of striploins at day 0, 45, 70, and 135 of refrigerated storage. The horizontal line within the box plot represents the median. The box upper and lower limits represent the interquartile range, and the bars represent the 1.5xInterquartile Range. D = No Wash Dry chill, S = No Wash Spray chill, WD = Wash Dry chill, WS = Wash Spray chill. a–c Box plots with different letters within each sampling date are significantly different (p < 0.05).

