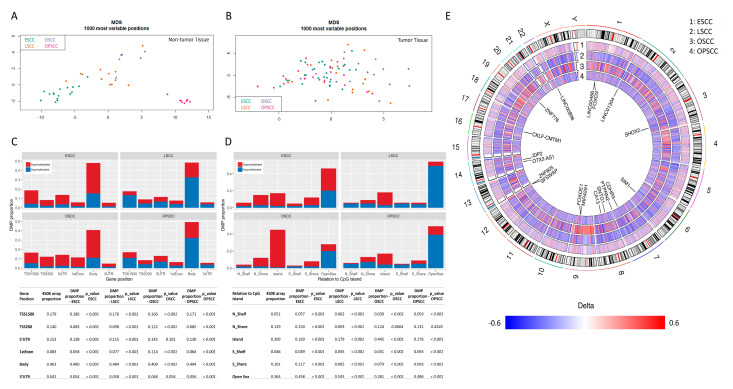
Figure 1.
Overall DNA methylation profile of head and neck and esophageal squamous cell carcinomas. (A) Principal component analysis of the 1000 most variable CpG sites in non-tumor tissues of esophagus, larynx, oral cavity and oropharynx. (B) Principal component analysis of the 1000 most variable CpG sites in squamous cell carcinomas of the esophagus, larynx, oral cavity and oropharynx. (C) Bar graphs showing the proportion of hypermethylated and hypomethylated probes, according to their genic location, for each tumor type relative to their non-tumor counterparts. In red: hypermethylated probes; in blue: hypomethylated probes. On the bottom, a table with the proportion of 450 K beadchip probes in each gene region as well as the proportion of DMPs in each gene region by tumor type is shown. p-values of chi-squared tests calculated based on the observed and expected absolute numbers of probes are also shown. (D) Bar graphs showing the proportion of hypermethylated and hypomethylated probes, according to their relation to CpG islands, for each tumor type relative to their non-tumor counterparts. In red: hypermethylated probes; in blue: hypomethylated probes. On the bottom, a table with the proportion of 450 K beadchip probes according to their relation to CpG island as well as the proportion of DMPs according to their relation to CpG island by tumor type is shown. p-values of chi-squared tests calculated based on the observed and expected absolute numbers of probes are also shown. (E) Circos plot showing the delta-betas (differences between the mean methylation in tumors and non-tumor tissues) for each probe in the beadchip according to tumor type. From the outer circle to the inner circle: esophageal squamous cell carcinoma (1), laryngeal squamous cell carcinoma (2), oral cavity squamous cell carcinoma (3) and oropharyngeal squamous cell carcinoma (4). The chromosomes are included in the center of the circus plot and genes carrying the 20 DMPs with the largest variances across tumor subsites are shown. Regions in red: hypermethylated sites in tumors relative to their non-tumor counterparts; regions in blue: hypomethylated sites in tumors relative to their non-tumor counterparts, regions in white: probes removed from the analysis for quality reasons or filtering purposes. ESCC, esophageal squamous cell carcinoma; LSCC, laryngeal squamous cell carcinoma; MDS, multidimensional scaling; OSCC, oral cavity squamous cell carcinoma; OPSCC, oropharyngeal squamous cell carcinoma.

