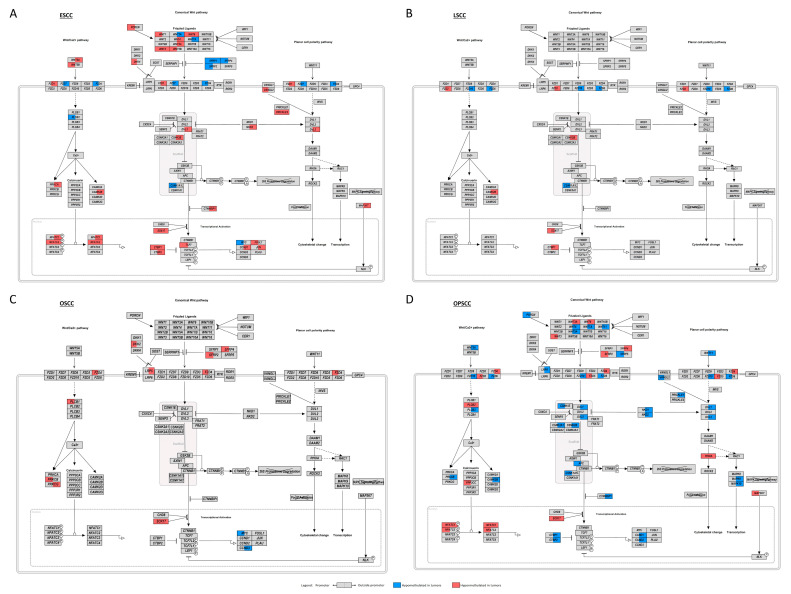
Figure 4.
WNT pathway disruption by DNA methylation alterations in ESCC, LSCC, OSCC and OPSCC. Schematic representation of the WNT pathway showing the genes involved and their DMR alterations in: (A) esophageal squamous cell carcinoma (ESCC); (B) laryngeal squamous cell carcinoma (LSCC); (C) oral cavity squamous cell carcinoma (OSCC); (D) oropharyngeal squamous cell carcinoma (OPSCC). Each rectangle represents a gene involved in the pathway and is divided into two halves: the left halves represent the DMRs annotated to promoters; and the right halves represent the DMRs annotated outside promoters. The colors indicate whether the region was found to be hypermethylated (red) or hypomethylated (blue) in each tumor relative to their respective non-tumor tissue. When more than one DMR was differentially methylated in a given region, the mean delta beta of all DMRs was represented.

