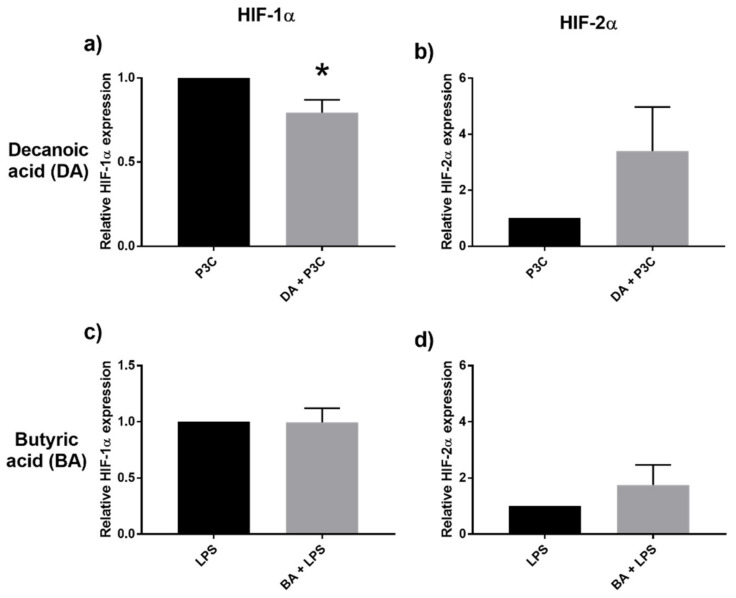
Figure 6.
Relative expression of HIF1α (a), HIF2α (b) after stimulation with decanoic acid (DA) 20μM and P3C, and after stimulation with butyric acid (BA) 20 μM and LPS (c,d), assessed by qPCR. Values are presented as mean ± SEM, results from at least 7 subjects were used. * p < 0.05 is the gene expression difference compared to the respective control (P3C/LPS) groups (black bar, normalized to 1), Wilcoxon signed rank test was used to determine significance.

