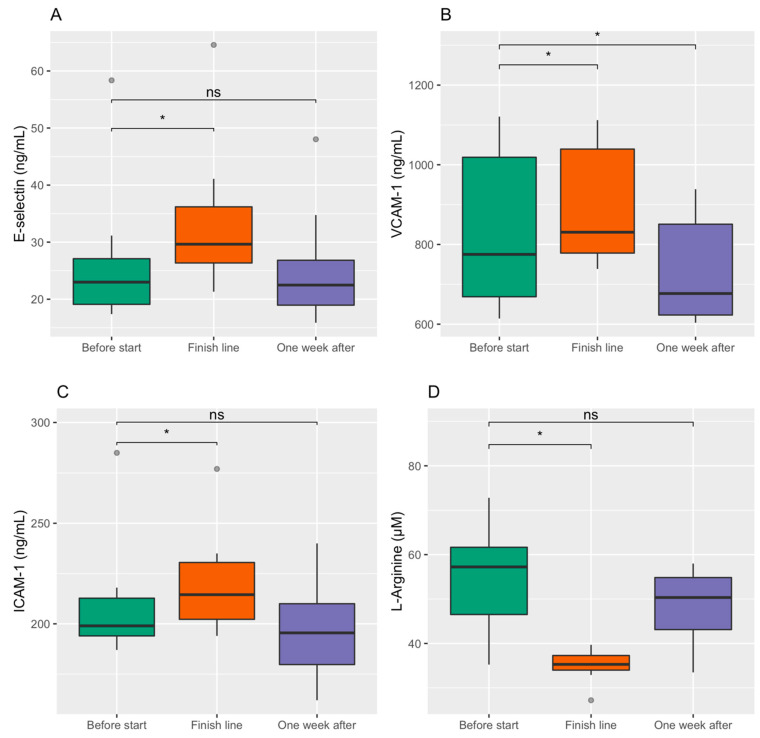
Figure 2.
E-selectin (A), VCAM-1 (B), ICAM-1 (C), and L-Arginine (D) before the start, at the finish line, and one week after the race with two-sided post hoc Wilcoxon Signed-Rank Sum tests. The boxplots are drawn with a thick line as median; boxes are the interquartile range (IQR) from 1. quartile to 3. quartile; whiskers are maximum value within 1.5 times IQR; values above or below 1.5 times IQR are shown as outliers. * Indicates p-value < 0.05 and ns a p-value > 0.05. Friedman’s Ranked Sum test for all the biomarkers showed a p-value < 0.05.

