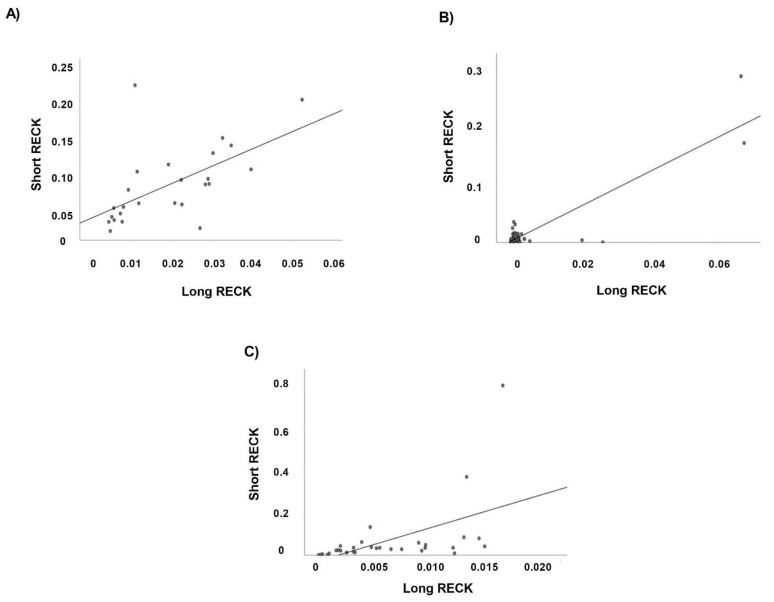
Figure 6.
Correlation analysis of Long and Short RECK splice variants in all case study. Scatter plots depict the relationship between the two RECK splice variants in (A) CTR (R2 = 0.355, p < 0.005, Pearson r = 0.601); (B) CAD (R2 = 0.793, p < 0.0001, Pearson r = 0.890); (C) AMI (R2 = 0.279, p < 0.005, Pearson r = 0.528).

