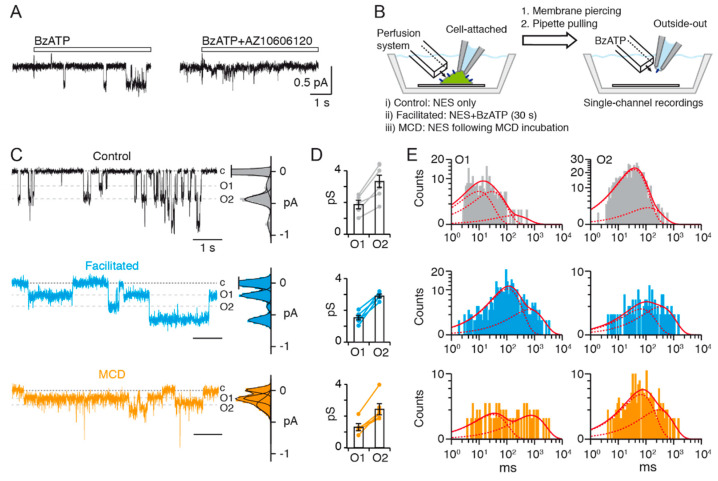
Figure 1.
Current facilitation of P2X7 results in an increase of single-channel open probability. (A) Single-channel currents elicited by 10 μM BzATP (duration of application indicated by the white bar) from an outside-out patch of HEK293T cell transiently transfected with rP2X7 (left) are inhibited by 1 μM AZ10606120 when co-applied with 10 μM BzATP (right). Traces are from the same patch and channel openings are downward deflections. (B) Cartoon depicting the protocol employed for establishing excised patches from cells expressing rP2X7 (blue ovals) in: (i) control conditions, (ii) facilitated conditions (10 μM BzATP for 30 s), and (iii) MCD-treated conditions. NES: normal extracellular solution. Figure not to scale. (C) Single-channel currents elicited by 10 μM BzATP from outside-out patches of HEK293T cells transiently transfected with rP2X7. Cells were either not treated (black), or pre-treated with a 30 s perfusion of 10 μM BzATP (blue), or incubated with MCD (orange) prior to membrane excising. Dashed grey lines indicate unitary currents corresponding to conductance states O1 and O2. Dotted lines indicate basal current corresponding to closed channels, labeled c. Corresponding all points histograms of currents are shown right of the traces. Distributions were fit by a sum of Gaussians. (D) Summary of corresponding unitary conductances. Linking lines indicate data points that originate from the same patches (n = 7 patches for control, 6 for facilitated and 7 for MCD-treated conditions). Bars represent mean ± SEM. (E) Corresponding open dwell-time histograms fitted by the sum (solid red line) of several exponential functions (dashed red lines). For control patches (grey histograms), τ1 = 9.6 ms, relative area, a1 = 0.49; τ2 = 29 ms, a2 = 0.48; τ3 = 180 ms, a3 = 0.03; mean open time, τO1 = 24 ms for O1, and τ1 = 38 ms, a1 = 0.92; τ2 = 119 ms, a2 = 0.08; τO2 = 44 ms for O2. For facilitated (blue histograms), τ1 = 108 ms, a1 = 0.77; τ2 = 654 ms, a2 = 0.23; τO1 = 234 ms for O1 and τ1 = 68 ms, a1 = 0.46; τ2 = 332 ms, a2 = 0.54; τO2 = 211 ms for O2. For MCD-treated patches (orange histograms), τ1 = 32 ms, a1 = 0.52; τ2 = 752 ms, a2 = 0.48; τO1 = 378 ms, for O1 and τ1 = 66 ms, a1 = 0.70; τ2 = 294 ms, a2 = 0.30; τO2 = 134 ms for O2. All data were recorded at −120 mV and filtered at a final fc of 100 Hz.

