Figure 7.
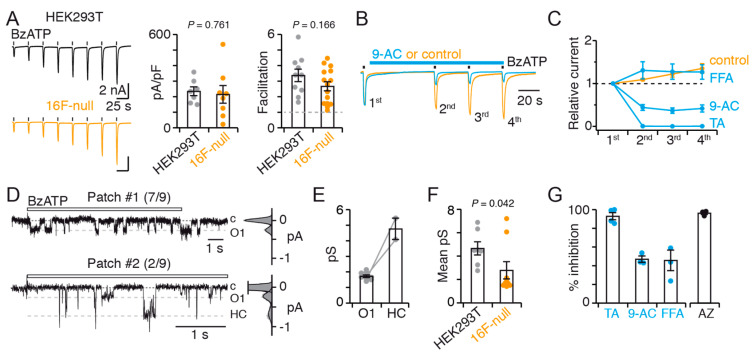
TMEM16F shapes P2X7 unitary conductance. (A) Left: whole-cell currents evoked by repeated 2 s applications of 10 μM BzATP recorded in HEK293T (black trace) and 16F-null cells (orange trace) transiently transfected with rP2X7. Middle: summary of current density of the 8th application (n = 7 for HEK293T cells and 8 for 16F-null cells). Bars represent mean ± SEM. Right: summary of current facilitation determined between the 8th and 1st application. See Materials and Methods for calculation (n = 10 cells for HEK293T and 15 for 16F-null). p values are from unpaired Student’s t-test. (B) Whole-cell currents evoked by repeated 2 s applications of 10 μM BzATP in the presence (blue) or absence of 9-AC (orange) in 16F-null cells transiently expressing rP2X7. Currents are normalized to the first application. (C) Summary currents relative to the first application in the absence (control) or presence of inhibitors (n = 4 cells for TA, 10 for 9-AC, 7 for FFA, and 8 for control). Symbols represent mean ± SEM. (D) Top (patch #1, representative of 7 out of 9 patches): single-channel currents elicited by 10 μM BzATP from an outside-out patch of 16F-null cell transiently transfected with rP2X7 exhibiting the O1 state (dashed grey line); c, closed state. Corresponding all points histogram of currents is shown right of the trace. Distributions were fit by the sum of two Gaussians. Bottom (patch #2, representative of 2 out of 9 patches): example of outside-out patches in which O1 and an additional high conductance (HC) were recorded (dashed grey lines). Currents were elicited by 10 μM BzATP. Corresponding all points histogram of currents is shown right of the trace. Distributions were fit by the sum of three Gaussians. Data were filtered at a final fc of 100 Hz. (E) Summary of corresponding unitary conductances in 16F-null cells. Linking lines indicate data points that originate from the same patches (n = 9 patches). Bars represent mean ± SEM. (F) Summary of mean P2X7 unitary conductances in HEK293T and 16F-null cells. Mean was calculated by averaging the sum of each state conductance determined from each patch (n = 7 patches for HEK293T cells and 9 for 16-null cells). Bars represent mean ± SEM. p value is from Mann-Whitney test. (G) Summary of single-channel inhibition (n = 4 patches for TA, 3 for 9-AC, 3 for FFA, and 3 for AZ10606120). Bars represent mean ± SEM. Inhibitor concentrations were 20 μM TA, 1 mM 9-AC, 100 μM FFA and 1 μM AZ10606120. Single-channel and whole-cell data were recorded at −120 and −60 mV, respectively.

