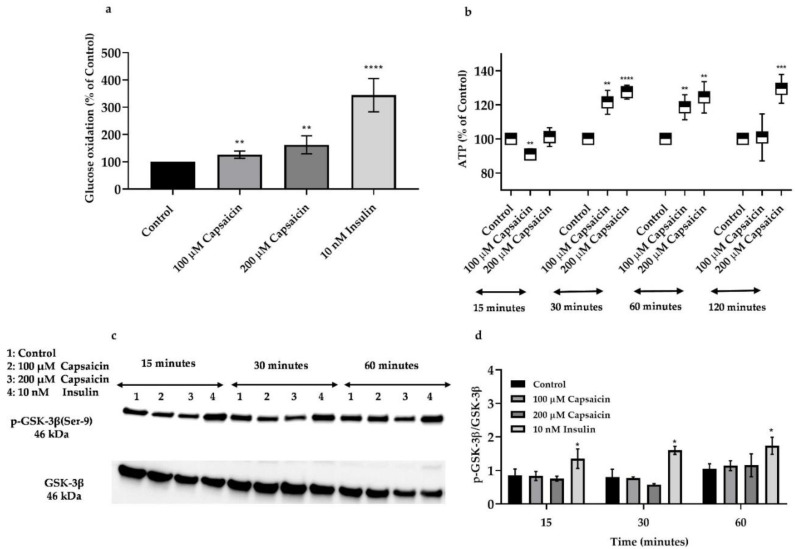
Figure 6.
Glucose oxidation levels, ATP levels, and Western blot analysis for phosphorylated and total GSK-3β in capsaicin and insulin-treated mouse skeletal muscle cells. (a) Glucose oxidation levels following 60 min incubation with 100 and 200 μM of capsaicin and 10 nM insulin. (b) Intracellular ATP generation in the 0, 100, and 200 μM capsaicin treated cells over 120 min incubation. (c) Representative Western blot for p-GSK-3β in the presence and absence of capsaicin and insulin over 60 min incubation. (d) Relative densitometric bar graph of GSK-3β in the capsaicin and insulin-treated mouse skeletal muscle cells over 60 min. Data are presented as mean ± SD of three independent repeats (n = 3). * p < 0.05, ** p < 0.01, *** p < 0.001, and **** p < 0.0001 indicate a significant difference between capsaicin/insulin-treated and control groups.

