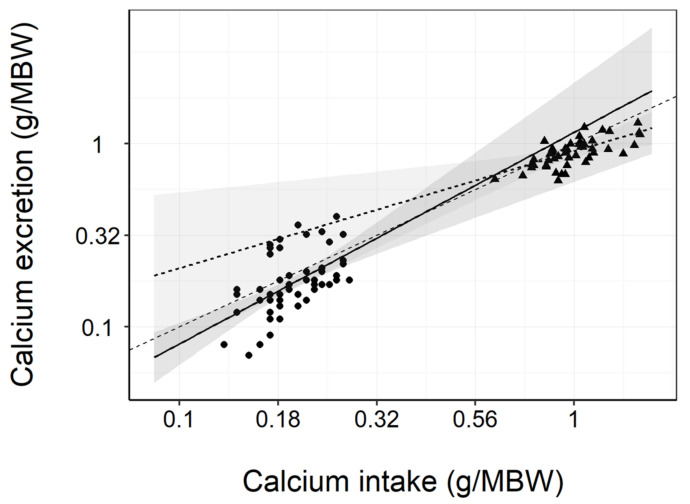
Figure 1.
Linear regression between dietary calcium (Ca) intake and fecal Ca excretion (g/kg bodyweight (BW)0.75; metabolic bodyweight (MBW)). The 95% confidence regions for both diet groups surround the y = x (-------) equivalence line. The control (n = 56; —●—) and test (n = 50; ---▲---) display as distinct clusters supporting the view that Ca excretion is in proportion to dietary Ca intake.

