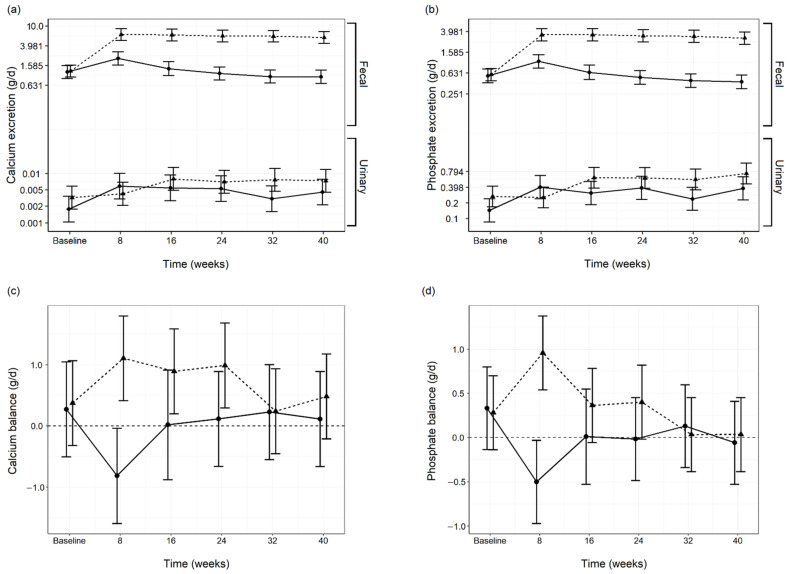
Figure 2.
Fecal and urinary calcium (Ca) excretion (a), fecal and urinary phosphate excretion (b), Ca balance (c) and phosphate balance (d) throughout the study in both the control (n = 6–8; —●—) and test (n = 10; ---▲---) diet groups. Data values are presented as means and 95% confidence intervals per diet group per time point.

