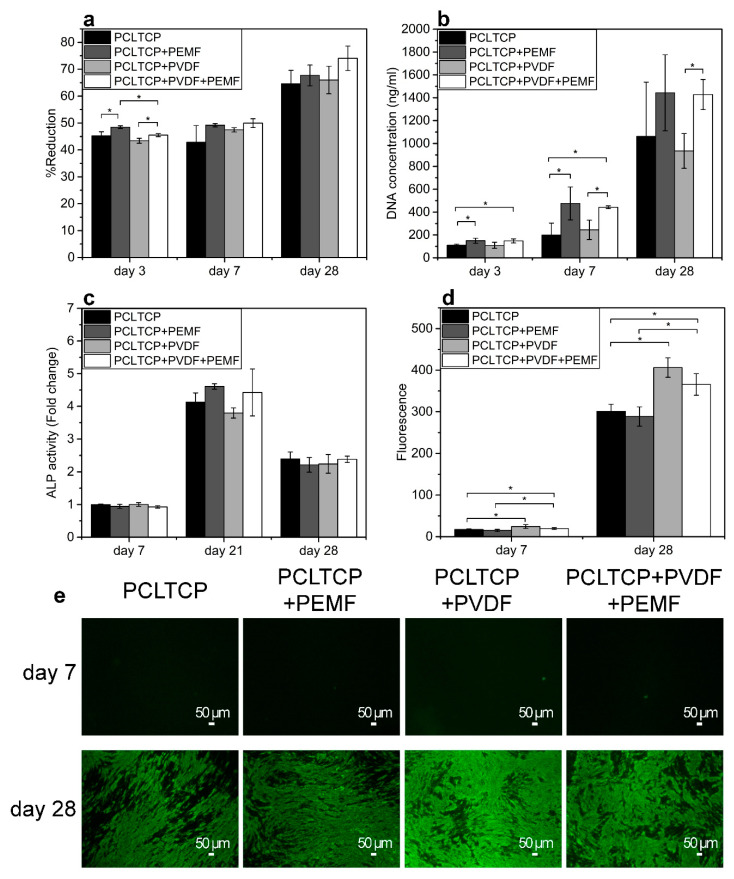
Figure 4.
(a) Cell metabolic activity by measuring the percentage of alarmaBlue reduction. (b) Cell proliferation quantified by DNA quantification. (c) Alkaline phosphatase (ALP) activity. (d) Quantification of Osteoimage fluorescence. (e) Osteoimage staining of hydroxyapatite rich regions (green). Sample groups: PCL-TCP without (PCL-TCP) and with PEMF (PCL-TCP+PEMF), PVDF-coated PCL-TCP without (PCL-TCP+PVDF) and with PEMF (PCL-TCP+PVDF+PEMF) (* p < 0.05, n = 3).

