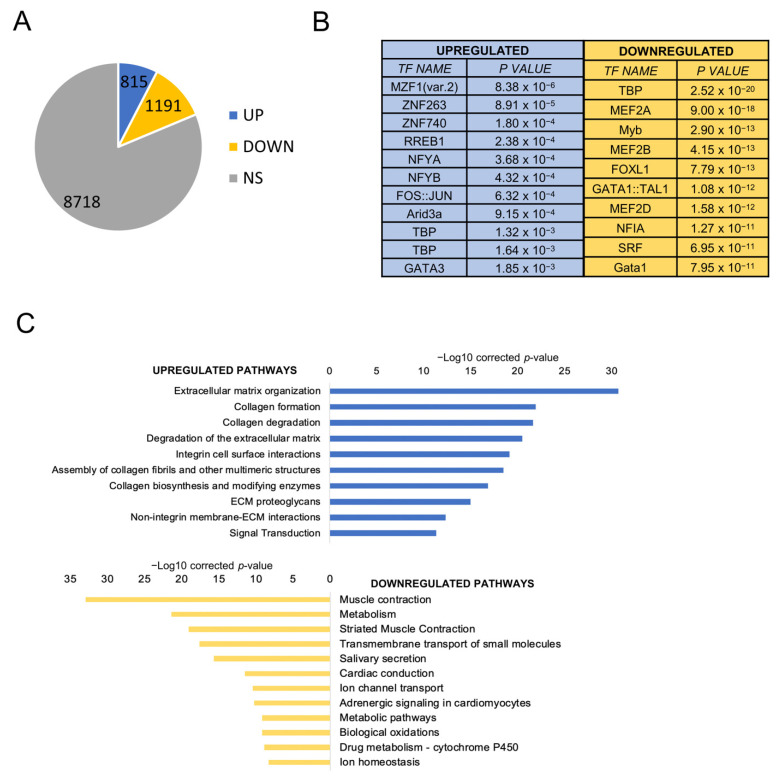
Figure 1.
Gene expression analysis of HNSCC TCGA tumors. (A). Up- and downregulated genes in HNSCC versus normal tissues. NS, not significant. (B). Pscan analysis of enriched TFBS in promoters (−450/+50 bps from the TSS) of up- and downregulated genes in HNSCC. (C). Reactome pathways enriched in upregulated genes (upper panel) and downregulated genes (lower panel) listed according to their p value. The list was obtained using KOBAS.

