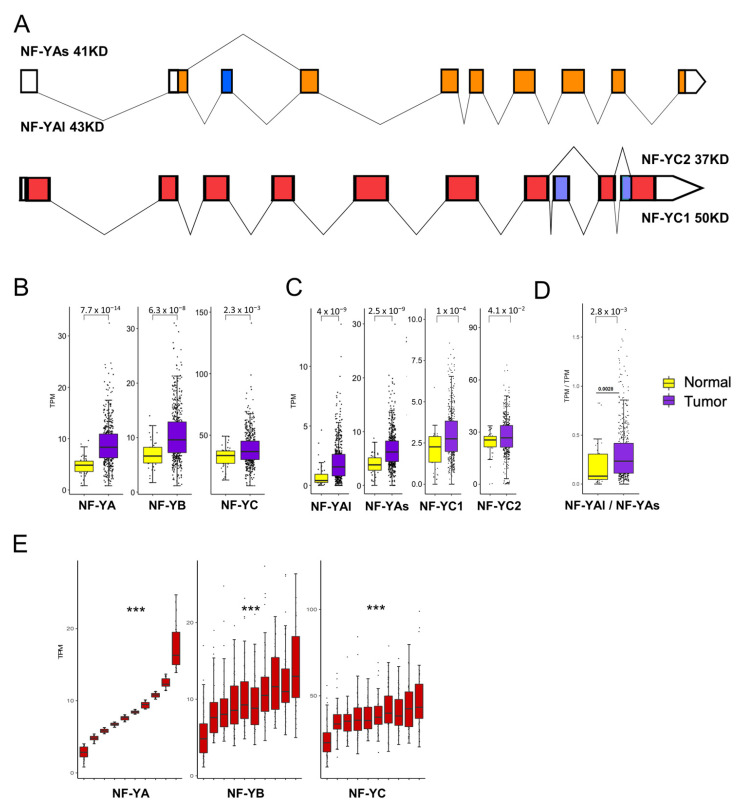
Figure 2.
NF-Y subunits are overexpressed in HNSCC. (A). Scheme of NF-YA and NF-YC alternative transcripts. (B). Box plots of the expression levels of the three NF-Y subunits at gene level in the TCGA HNSCC dataset, measured in TPMs. (C). As in A, the NF-YAs, NF-YAl and NF-YC isoform levels were analyzed. NF-YC2 corresponds to the 37 kD isoform; NF-YC1 to the 50 kD isoform. (D). Box plots of the expression levels of the ratio of the two NF-YA isoforms. (E). Expression of NF-YB/NF-YC (right panels) according to 10 ranked bins of increasing NF-YA levels (left panels). p values were calculated using the Wilcoxon rank sum test: *** p value < 0.0001.

