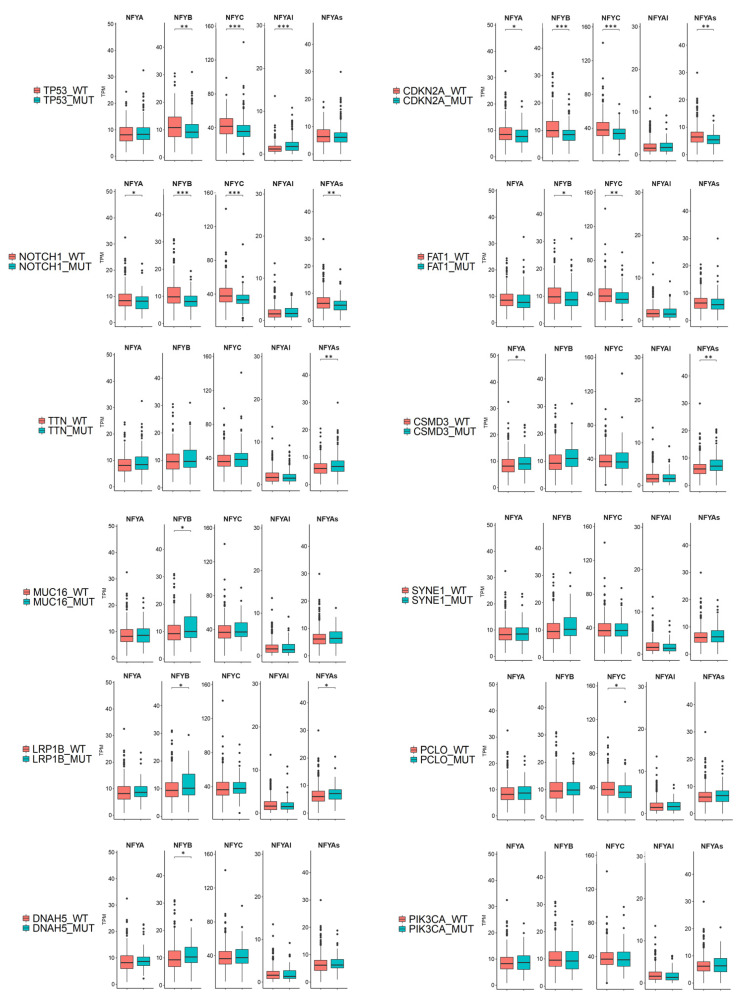
Figure 4.
Expression levels of NF-Y isoforms according to common mutations in HNSCC. Relative levels of expression of the NF-Y subunits and isoforms (TPMs) in HNSCC tumors presenting the 12 most common mutations, as indicated in the different Panels. p values were calculated using a Wilcoxon signed-rank test. * p value < 0.05; ** p value < 0.01; *** p value < 0.001.

