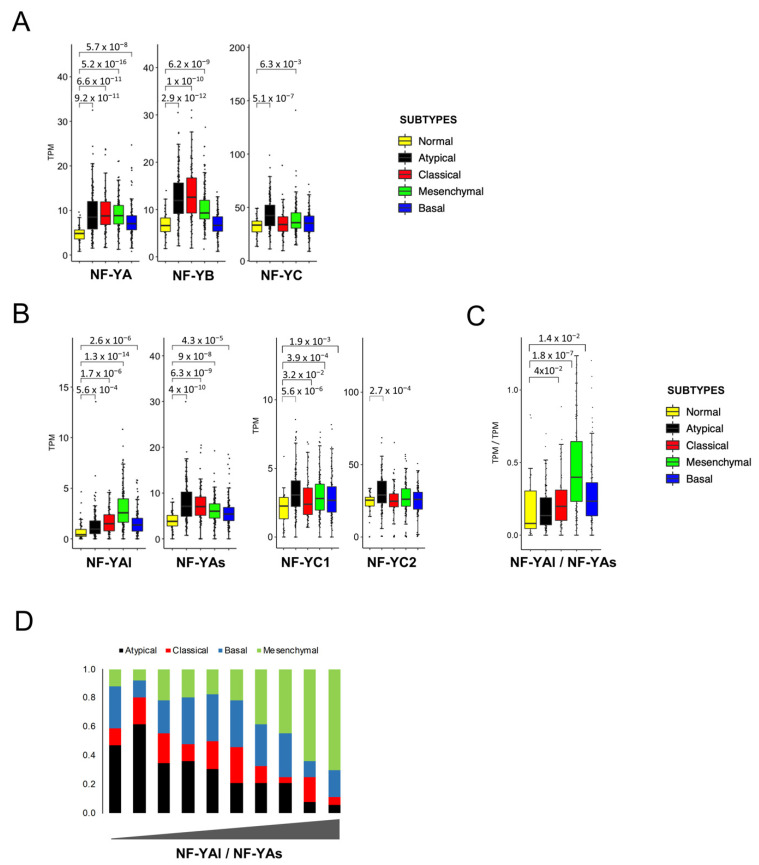
Figure 5.
NF-Y subunit expression in HNSCC subtypes. (A). Box plots of expression levels of the three NF-Y subunits at gene level in the four subtypes and normal samples of the TCGA HNSCC dataset, measured in TPMs. (B). As in A, with the NF-YAs, NF-YAl, NF-YC1 and NF-YC2 subunits. (C). Box plots of the expression levels of the ratio of the two NF-YA isoforms. p values were calculated using the Wilcoxon rank sum test. (D). Partitioning of HNSCC subtypes according to increasing NF-YAl/NF-YAs ratios, divided into 10 bins.

