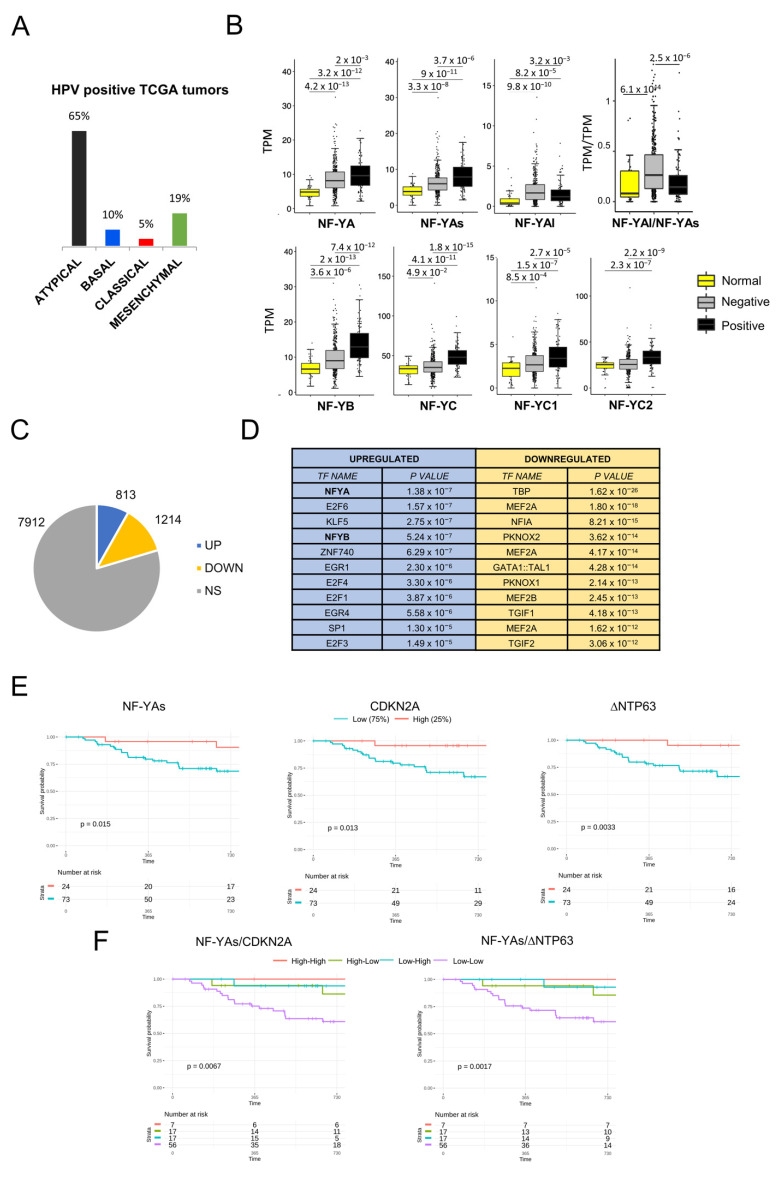
Figure 6.
Analysis of NF-Y subunits expression in HPV-positive HNSCC. (A). Partitioning of all TCGA HNSCC subtypes according to HPV positivity. (B). Box plots of the expression levels of NF-Y subunits at gene and isoform levels in the TCGA HPV-positive and HPV-negative HNSCC, measured in TPMs. p values were calculated using the Wilcoxon rank sum test. (C). Up- and downregulated genes in HPV-positive versus normal tissues. NS, not significant. (D). Pscan analysis of enriched TFBS in promoters (−450/+50 bps from the TSS) of up- and downregulated genes in HPV-positive HNSCC tumors. (E). Progression-free interval curves of the survival probability of HNSCC tumors with stratification according to the expression of NF-Y subunits. (F). Progression-free interval curves of the survival probability of HNSCC tumors with stratification according to the combination of expression of NF-YAs and CDKN2A or ΔNTP63.

