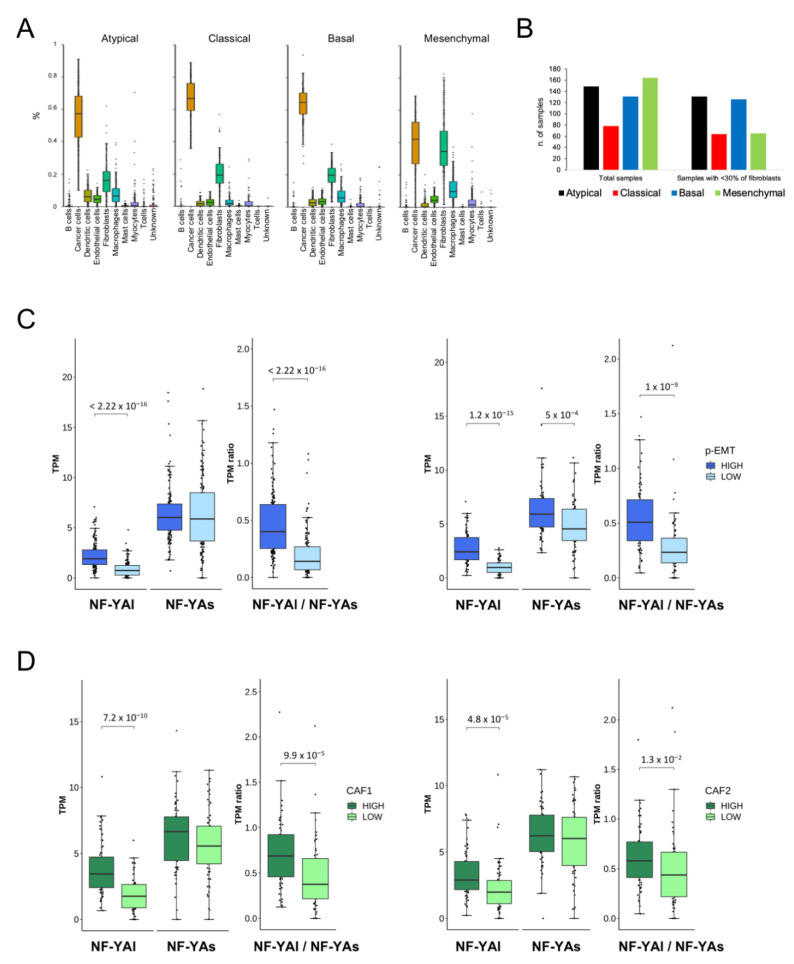
Figure 7.
Correlation of NF-YA isoforms according to deconvolution of the scRNA-seq analysis. (A). Proportion of the individual cell populations, as predicted based on scRNA-seq deconvolution of tumors, within the TCGA HNSCC subtypes. (B). Subtype distribution of all TCGA tumor samples before (left panel) and after (right panel) elimination of samples with a predicted fibroblasts population of >30%. (C). Left panels: box plots of NF-YA isoforms and NF-YAl/NF-YAs ratio, according to the p-EMT signature: total TCGA samples are divided into high and low. Right panels: As in C, except that the analysis was limited to Basal and Mesenchymal tumors of the TCGA classification. (D). As in C (left panels), except that CAF1 (left panels) and CAF2 (right panels) signatures were used in the total TCGA samples. p values were calculated using the Wilcoxon rank sum test.

