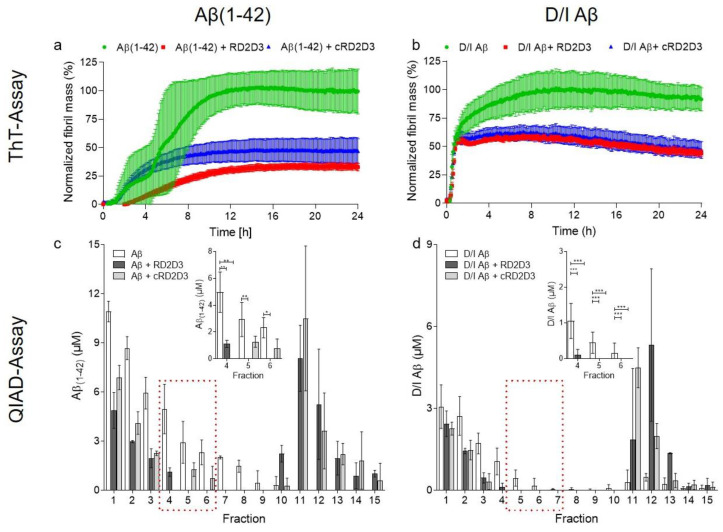
Figure 2.
RD2D3 and cRD2D3 inhibited the Aβ(1-42) and D/I Aβ fibril formation and eliminated significantly toxic oligomers. ThT-Assay (upper panel). Both d-peptides, RD2D3 (red) and cRD2D3 (blue), were analyzed according to their ability to inhibit either the Aβ(1-42) (a,left) or the D/I Aβ (b,right) fibril formation by use of equimolar concentrations (10 µM). All analyzed d-peptides were able to inhibit either the Aβ(1-42) (a) or the D/I Aβ (both green) (b) fibril formation. Fibril mass was normalized to the Aβ control. Data are presented as mean ± SD (N = 3 out of three independent experiments). QIAD-Assay (lower panel). Aβ(1-42) (c,left) and D/I Aβ (d,right) size distribution without (white) or with d-peptide were analyzed by density gradient centrifugation with subsequent measurements of the Aβ concentrations. Aβ-oligomers are located in fractions 4–6. Comparison of 20 µM RD2D3 (dark grey) and 20 µM cRD2D3 (light grey) (c) revealed similar Aβ(1-42) (80 µM) oligomer elimination efficacy of both d-peptides. Comparison of 10 µM RD2D3 (dark grey) and 10 µM cRD2D3 (light grey) (d) revealed higher potency of RD2D3 to eliminate toxic D/I Aβ (40 µM)-oligomers than cRD2D3 does. Data are presented as mean ± SD (N = 2–5) *** p < 0.001, ** p < 0.01 and * p < 0.05.

