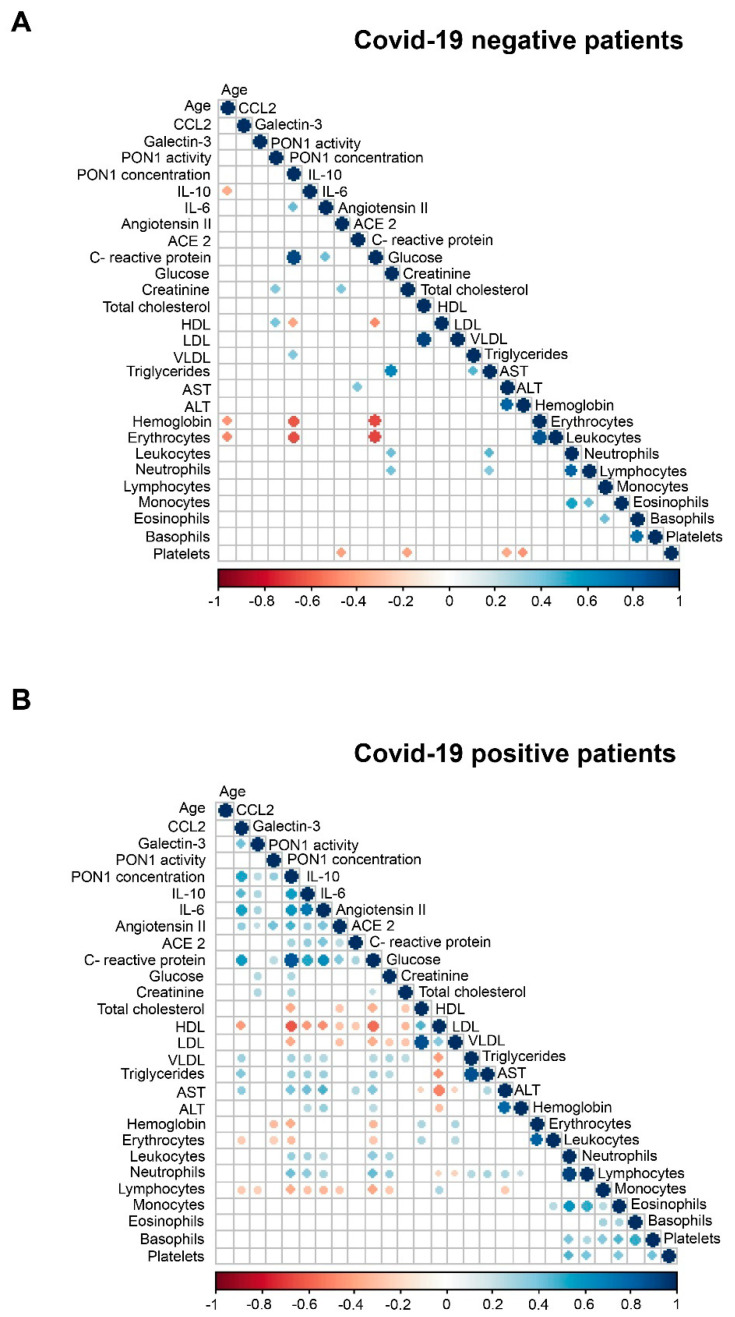
Figure 2.
Spearman correlation matrices of analytical variables in COVID-19 negative (A) and COVID-19 positive (B) patients. The magnitude and direction of the correlations are shown by circle size (larger is stronger) and with colors (positive correlation: blue; negative correlation: red), respectively.

