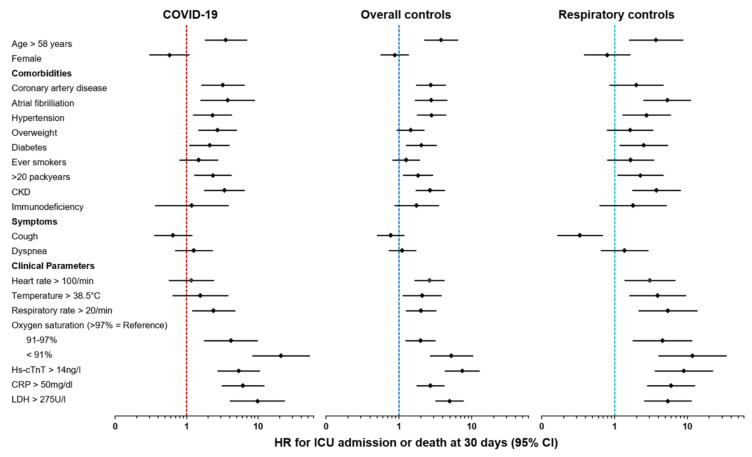
Figure 2.
Forest plots for HR of clinical parameters for ICU admission and death at 30 days in COVID-19, overall controls, and respiratory controls. X-axis shows HR in logarithmic scaling. Higher HR suggests higher association with poor outcome; COVID-19 = coronavirus disease 2019, CKD = chronic kidney disease, hs-cTnT = high-sensitivity troponin T, CRP = c-reactive protein, LDH = lactate dehydrogenase, HR = hazard ratio, ICU = intensive care unit, CI = confidence interval.

