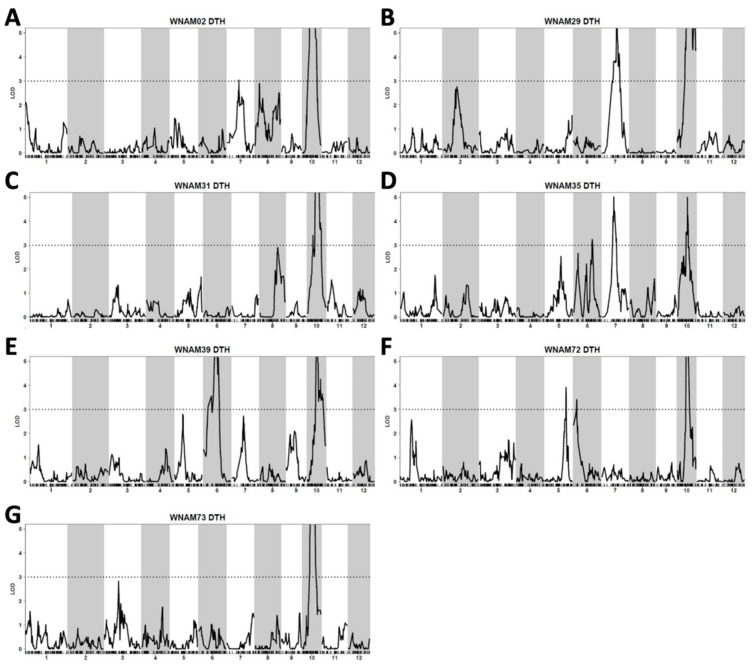
Figure 2.
Interval mapping showing the locations of days to heading QTL in aus nested association mapping (aus-NAM) families using R/QTL scanone function. (A) WNAM02, (B) WNAM29, (C) WNAM31, (D) WNAM35, (E) WNAM39, (F) WNAM72, and (G) WNAM73. The black lines correspond to LOD score profile (Y-axis) as a function of distance in cM across each chromosome (X-axis). Horizontal dotted lines in all panels indicate the LOD threshold value of 3.

