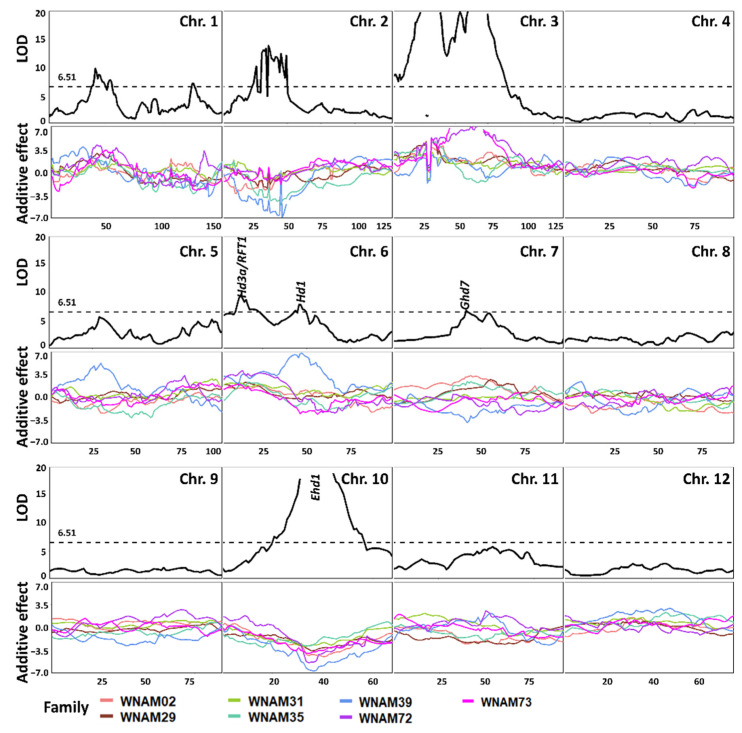
Figure 3.
LOD profile of QTL (top of each panel) and its additive effects (bottom of each panel) detected by joint inclusive composite interval mapping (JICIM). Scanning step was 1 cM, and the dotted horizontal line (6.51) represents thresholds obtained from 1000 permutation tests with type I errors of 0.05. Different line colors in additive effect panels represent different families. The positions of known loci (RFT, Hd3a, Hd1, Ehd1) are shown in the panels of chromosomes 6, 7, and 10.

