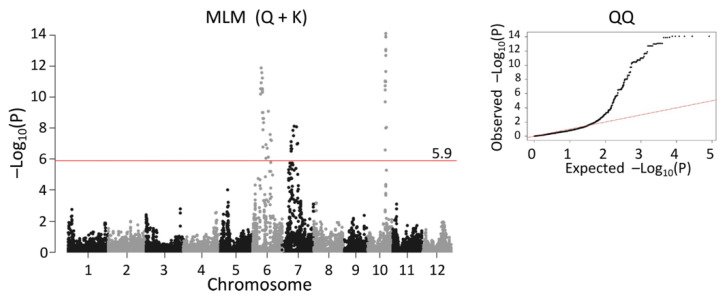
Figure 4.
Manhattan plot of days to heading using mixed linear model with principal components (Q) and genomic kinship (K) as covariates (MLM (Q + K)). The red horizontal line marks the threshold for genome-wide significance (5.9) on a −log10 scale. A quantile–quantile (QQ) plot is shown in the right panel, where the observed p-values (Y-axis) against the expected p-values (X-axis) under the null hypothesis of no association are plotted on a −log10 scale. Each black dot indicates an SNP.

