Figure 1.
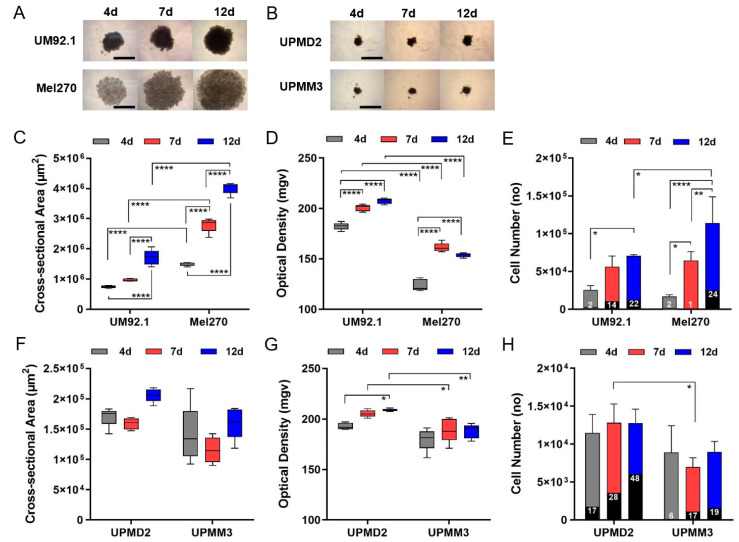
Generation of 3D tumor spheroids from UM and UPM cell lines. UM or UPM cells were seeded at 5000 cells per well. (A) Spheroids generated from UM cell lines UM92.1 and Mel270. Representative images are shown at day 4, 7 and 12 (4× magnification; scale bar of (A) represents 1000 µm). (B) Spheroids generated from UPM cell lines UPMD2 and UPMM3. Representative images are shown at day 4, 7 and 12 (4 × magnification; scale bar of (B) represents 1000 µm). (C,F) Spheroid cross-sectional area (µm2) and (D,G) optical density (mgv, mean grey value) were determined (n = 5 each time point). (E) UM spheroids or (H) UPM spheroids were trypsinized, stained with trypan blue and live/dead cell numbers were counted at day 4, 7 and 12. Dead cells are indicated by black columns; % of dead cells is given. A statistical analysis was performed using a two-way ANOVA and Tukey’s multiple comparisons test; significance levels are indicated * p < 0.05, ** p < 0.01, **** p < 0.001.

