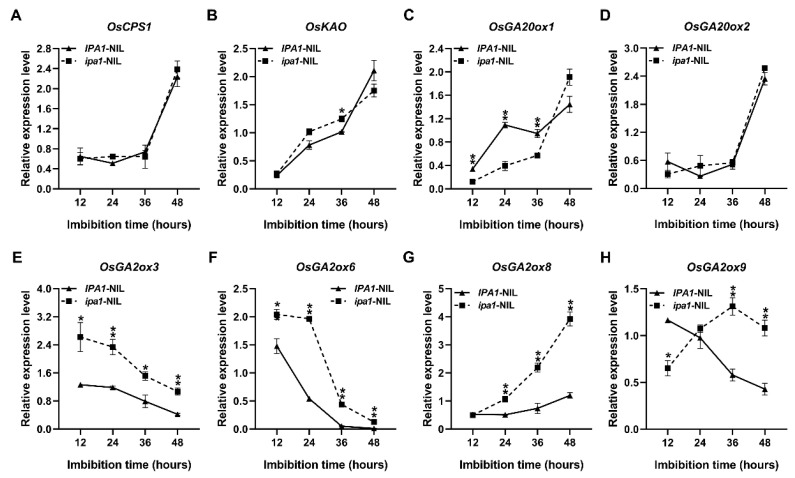
Figure 4.
The transcript levels of genes related to GA biosynthesis and inactivation at different time points. (A–D) The relative expression level of GA biosynthesis-related gene OsCPS1 (A), OsKAO (B), OsGA20ox1 (C), and OsGA20ox2 (D). (E–H) The relative expression level of GA metabolism-related gene OsGA2ox3 (E), OsGA2ox6 (F), OsGA2ox8 (G), and OsGA2ox9 (H). Values are means ±SE (n = 3). Significant differences were determined using Student’s t-test (* p < 0.05, ** p < 0.01).

