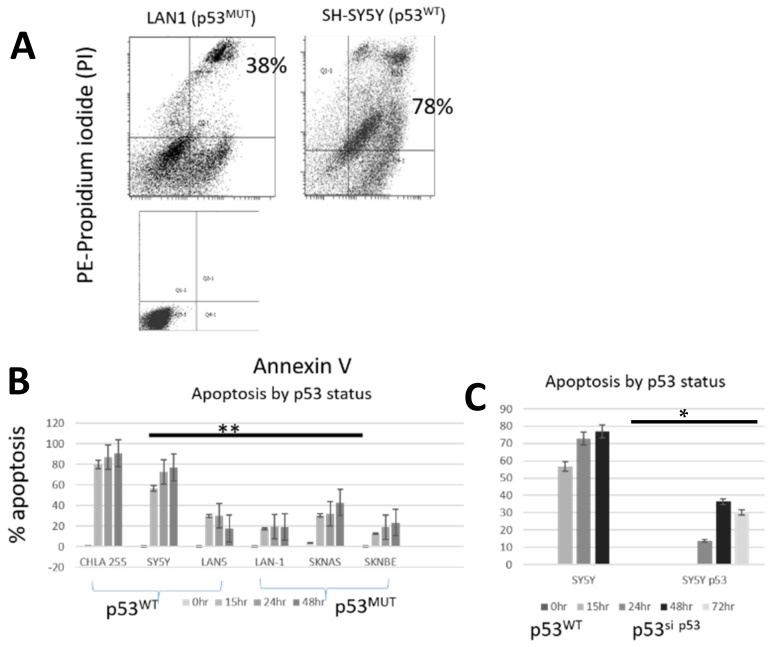
Figure 2.
Apoptosis in neuroblastoma cell lines after treatment with pevonedistat at the IC50. (A) Annexin/PI staining in representative cell lines plus control. Annexin measured by +/+ i.e., positive for both annexin and PI. (B) Apoptosis by p53 status. (C) Apoptosis in SH-SY5Yand SH-SY5Y p53 knock down cell lines. ** p < 0.01; * p < 0.05. Data is representative of repeat experiments.

