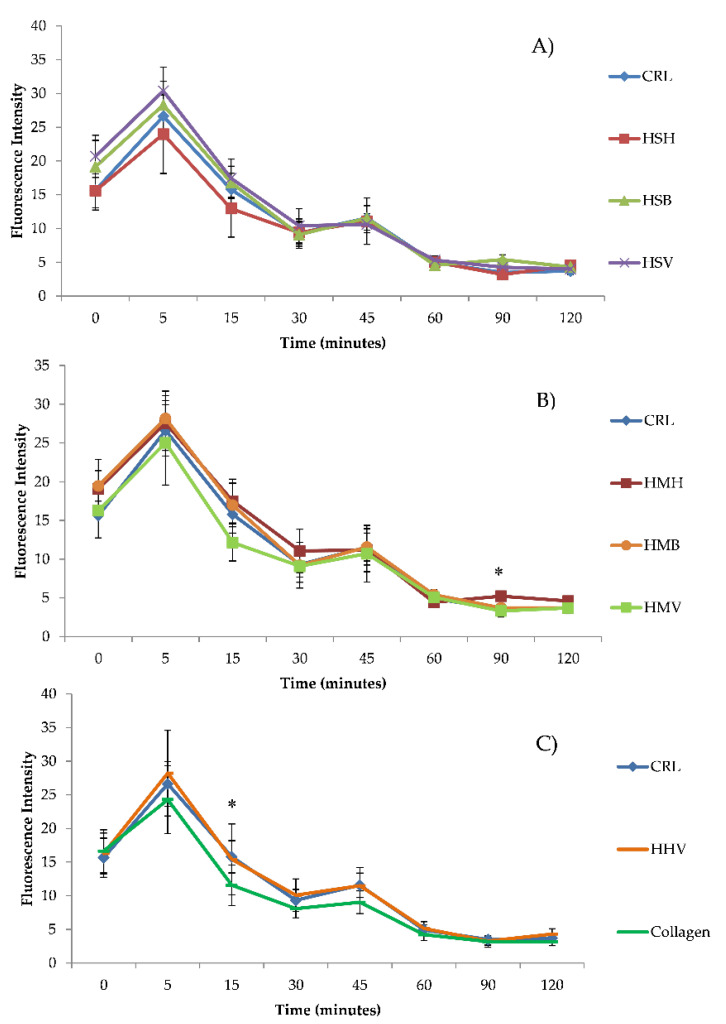
Figure 3.
Time dependence of ROS-induced fluorescence in Caco-2/TC7 cells exposed to (A) salmon hydrolysates, (B) mackerel hydrolysates, and (C) herring hydrolysates and fish collagen at 1 mg/mL without oxidative stress induced by H2O2. Results are expressed as the mean ± SEM (n = 3). (*) p ≤ 0.05 indicates significant differences compared to the control (CRL).

