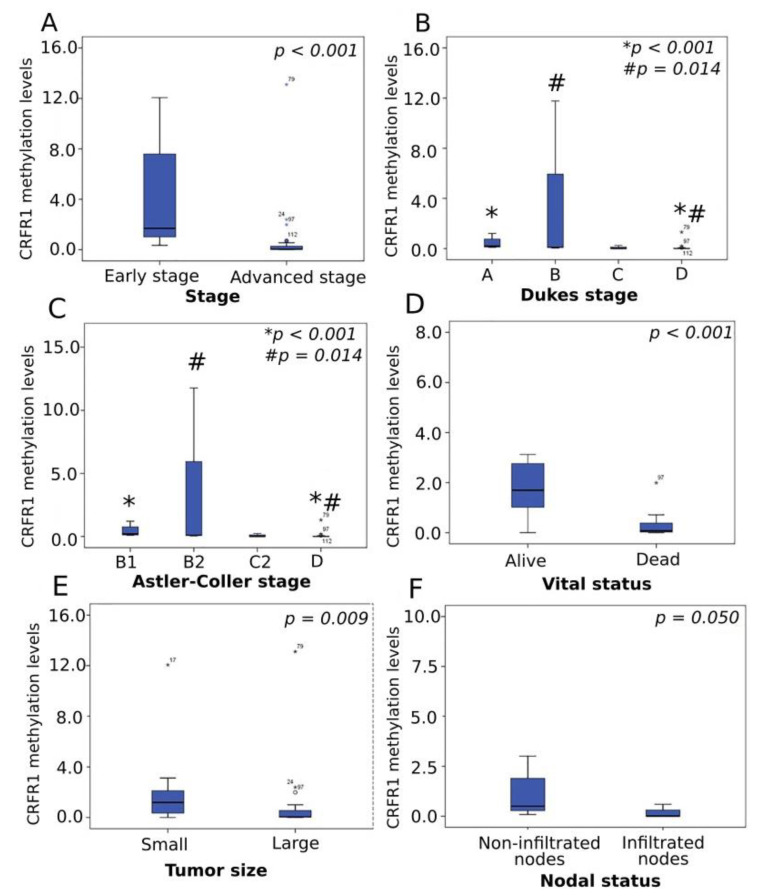
Figure 3.
Correlation of CRFR1 methylation levels with clinical parameters. Boxplots depict CRFR1 methylation levels in relation to (A) stage, (B) Dukes stage, (C) Astler–Coller stage, (D) vital status, (E) tumor size and (F) nodal status; * p: A vs. D for Dukes stage and B1 vs. D for Astler–Coller stage; # p: B vs. D for Dukes stage and B2 vs. D for Astler–Coller stage.

