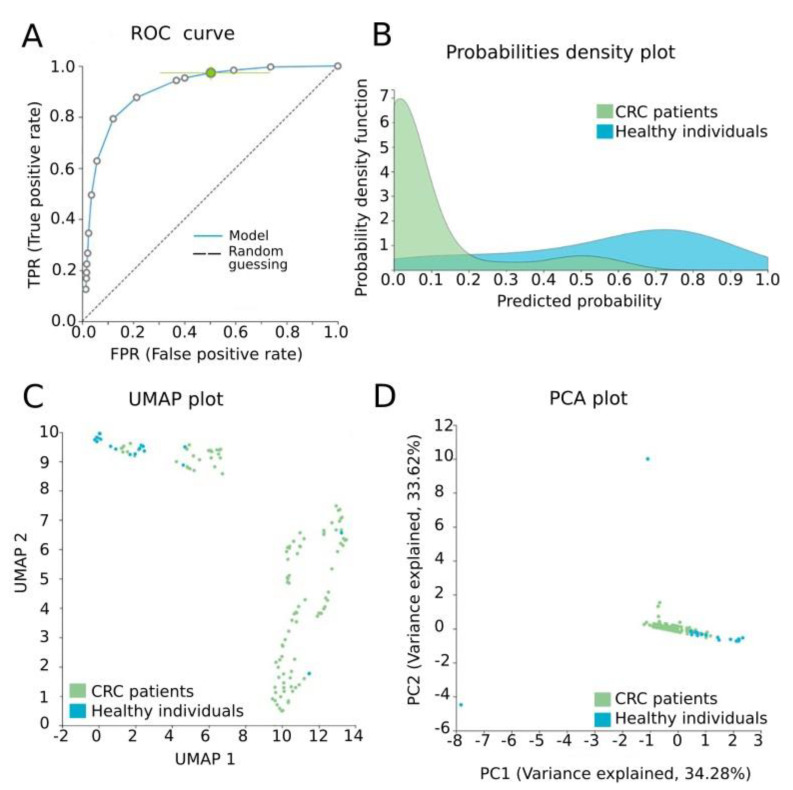
Figure 4.
Model performance for the discrimination of CRC patients from healthy individuals. (A) ROC curve of the model, AUC: 0.929 (0.873, 0.972). (B) Probabilities density plot depicting distributions between normal (class 0, green) and CRC ccfDNA samples (class 1, blue). (C) UMAP plot showing sufficient discrimination between normal (class 0, blue) and CRC ccfDNA samples (class 1, green). (D) PCA plot presenting a good separation between normal (class 0, blue) and CRC ccfDNA samples (class 1, green). ROC: receiver operating characteristic; PCA: principal component analysis; UMAP: uniform manifold approximation and projection.

