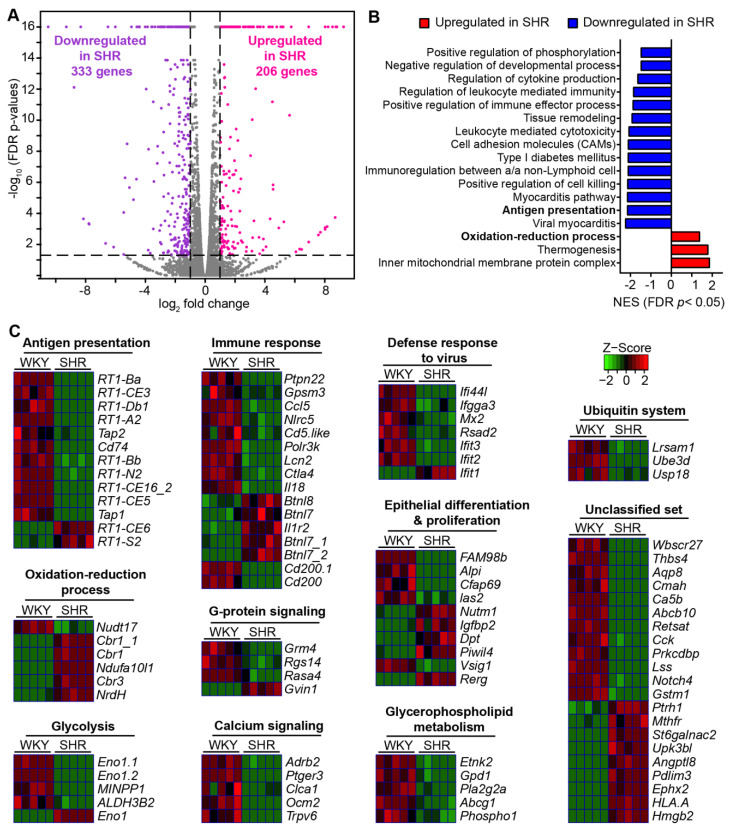
Figure 1.
Comparison of the transcriptional program of colonic organoids of WKY and SHR. (A) Volcano plot showing differentially expressed genes (DEGs) comparing the colonic organoids of WKY with SHR (FDR-corrected p < 0.05, absolute fold change ≥ 2, purple dots show downregulated genes in SHR, pink dots show upregulated genes in SHR). Gray plots indicate that the genes were not differentially expressed (n = 5 per group). (B) Hallmark pathways significantly enriched in colonic organoids of SHR compared with WKY (Adjusted p < 0.05). NES: normalized enrichment score. (C) Heat map of DEGs in the annotated pathways, FDR-corrected p < 0.05, absolute fold change ≥ 2.

