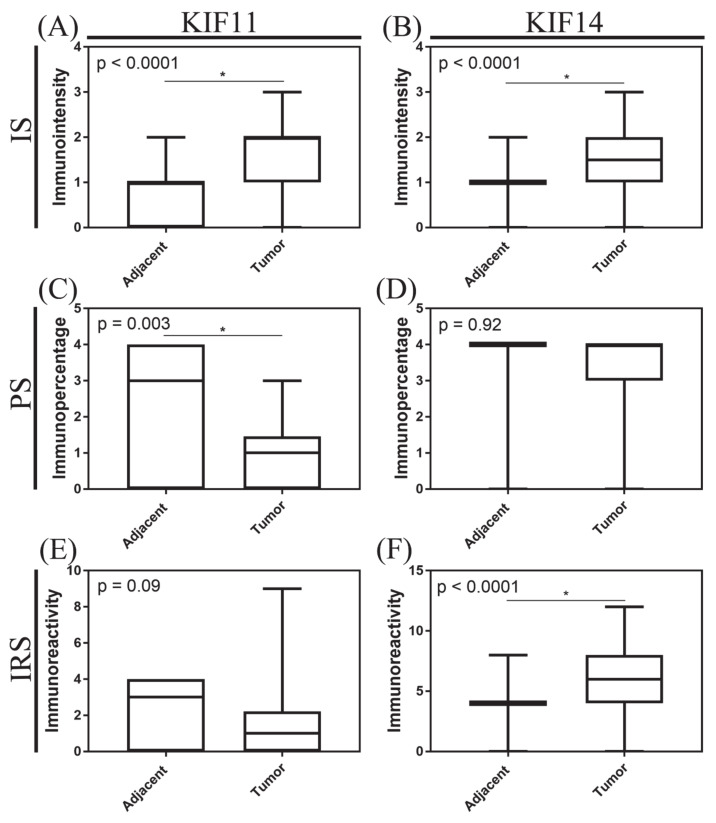
Figure 2.
Immunoexpression of KIF11 and KIF14 in pancreatic ductal adenocarcinoma. The X axis of the plot represents histologically normal tissue that was adjacent to tumor tissue vs. cancer tissue, and the Y axis represents immunointensity, IS (A,B); immunopercentage, PS (C,D); or immunoreactivity, IRS (E,F). The top and bottom of the error bars represent the maximum and minimum values of data, respectively. The asterisk indicates statistical significance (* p < 0.05, Mann–Whitney test).

