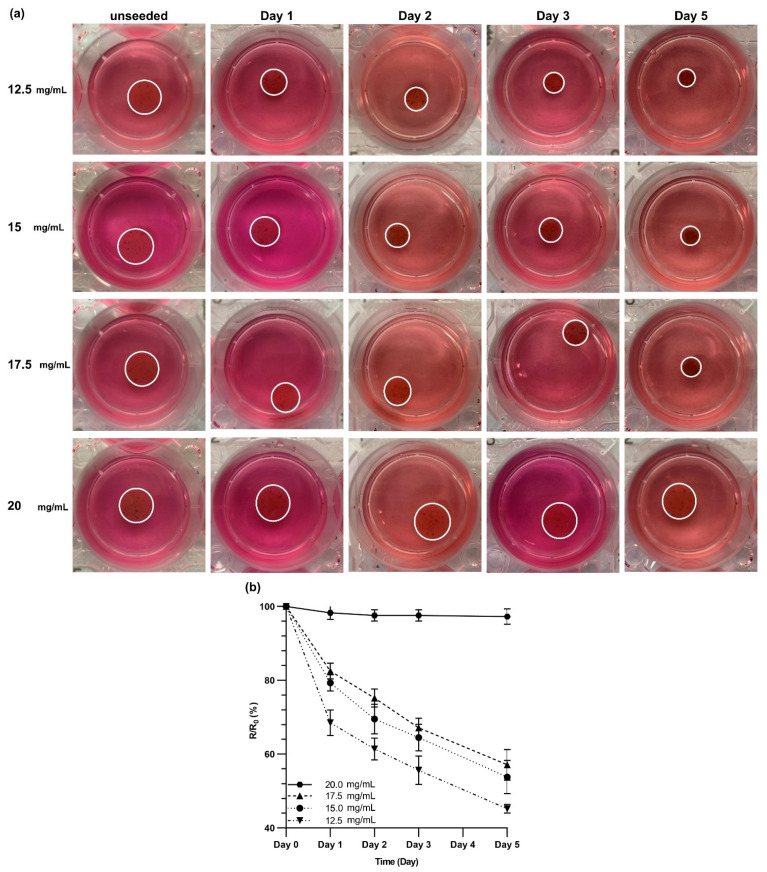
Figure 6.
Contraction of dECM hydrogels over five days of 3D culture. (a) Primary human fibroblast cells were cultured within dECM hydrogels with various concentrations, and these were imaged over five days to measure the decrease in the diameter. (b) The ratio of the measured radius to the radius of the unseeded control gels at the given day. This graph shows a significant reduction in the diameter of dECM hydrogels with concentrations of 12.5, 15, and 17.5 mg/mL. Sstatistical analysis and p-values can be found in Figure S5 in the supplementary.

