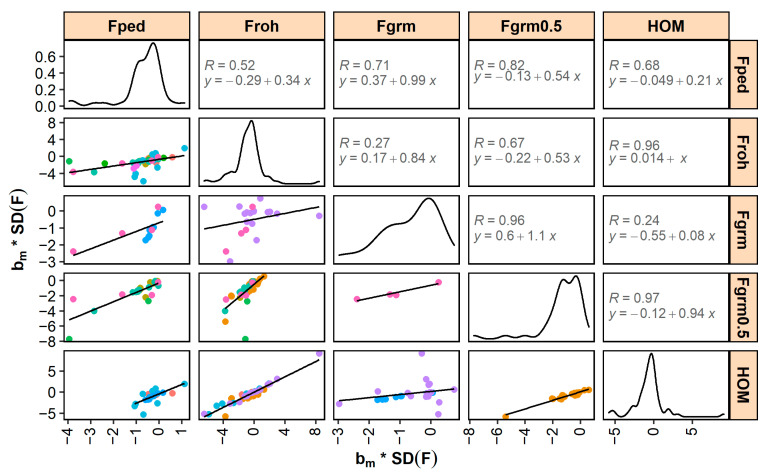
Figure 3.
Relationship between inbreeding depression estimates expressed as percentage of a trait’s mean per 1 standard deviation increase in inbreeding ( * SD(F)) across different measures of inbreeding. The data points (colored per study) and linear trendline are shown (lower triangle) as well as the density curve for each inbreeding measure (diagonal) and the correlation and regression equation (upper triangle). Note that slopes of the linear trendline differ from 1, which is also expected when correlations between inbreeding measures themselves are not equal to 1. = pedigree inbreeding; = inbreeding based on runs of homozygosity; = inbreeding from genomic relationship matrix (studies in pink and purple used VanRaden’s method 2, and light blue Yang’s method); = inbreeding from genomic relationship matrix with allele frequencies fixed to 0.5; = percentage of homozygous SNPs.

