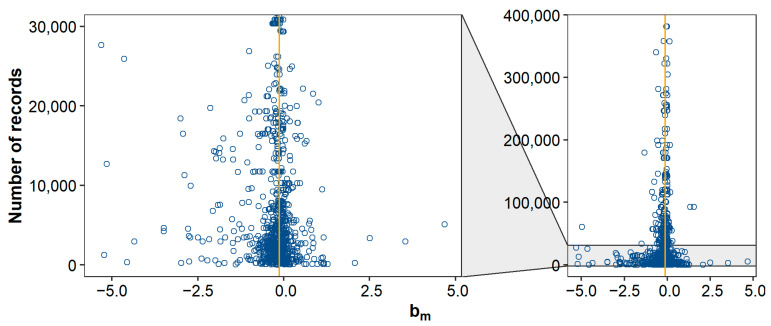
Figure 6.
Funnel plot to assess publication bias. The plot shows the relationship between inbreeding depression estimates, expressed as a percentage of the trait mean (), and the number of records used to estimate them (N = 1283). The orange vertical line represents the median. To ease interpretation, estimates based on >400,000 records are not shown (N = 82).

