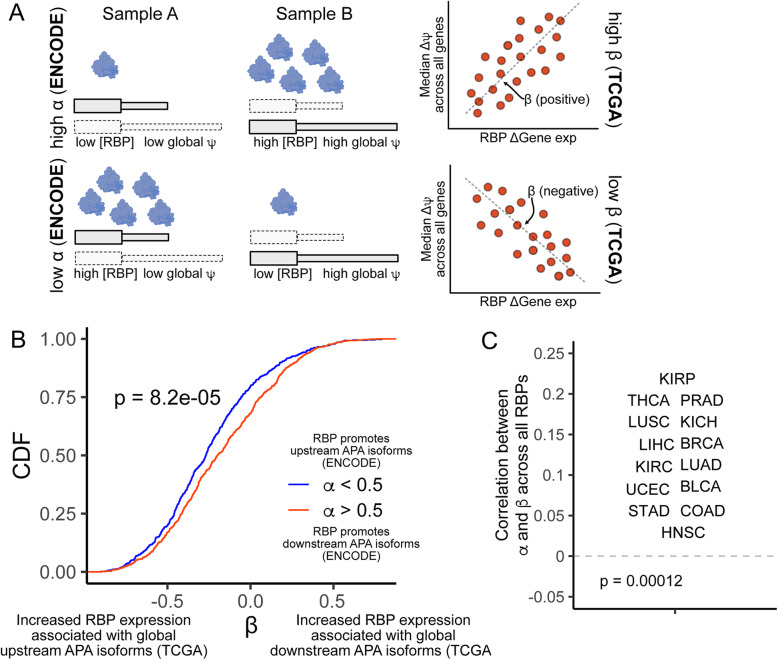
Fig. 7.
APA is regulated by RBP expression in ENCODE and TCGA data. (A) Diagram depicting connections between changes in RBP expression between condition and widespread, global in changes in ψ. Left: In Fig. 4, RBPs were assigned a value, α, based on the effect that their knockdown had on the Δψ values for all genes. α was defined as the fraction of genes that displayed increased ψ values in control knockdown samples compared to RBP knockdown samples. The expression of RBPs with high α values was therefore associated with increased ψ values transcriptome-wide (top) while expression of RBPs with low α values was correlated with decreased ψ values transcriptome-wide (bottom). Similar RBP effects were calculated in TCGA data (right) by comparing the change in RBP expression between two matched samples with transcriptome-wide changes in values. A value, β, was defined as the correlation between changes in RBP expression and the median Δψ across all genes with significant Δψ values (FDR < 0.05). α and β are therefore comparable in relating RBP expression and transcriptome wide changes in with the former designed for ENCODE RBP knockdown data and the latter designed for TCGA paired sample data. (B) β values for RBPs with low α values (α < 0.5, blue) and high α values (a > 0.5, red). Here, an RBP’s β value considers the correlation between its expression and global ψ across all TCGA sample pairs. The p value was calculated using a Wilcoxon ranksum test. (C) Correlation between α and β values across all RBPs for all TCGA sample pairs, separated by cancer type. The p value was calculated using a binomial test for deviation from the expected 0.5 probability that a cancer’s correlation between α and β would be positive

