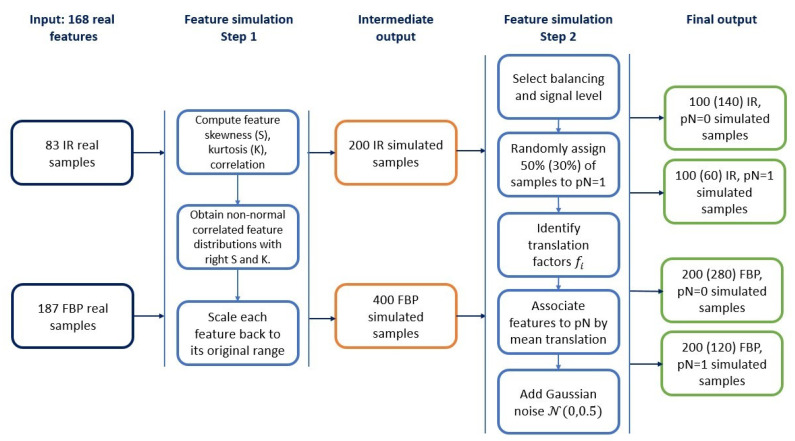
Figure 1.
Simulation procedure flow chart. Input are two sets of 168 real features, derived from CT (Computer Tomography) images reconstructed with the Filtered Back Projection (FBP) and Iterative Reconstructions (IR) algorithm, respectively (left column). The first step of the procedure (second column) describes how to obtain simulated features not associated to the outcome, which represents an intermediate output (middle column). The second part of the procedure (fourth column) associates samples and features to the outcome variable and provides as the final output, different sets of 168 features (right column). Cardinality of those sets depends on algorithm and sample balancing: sizes for balanced cases are reported, with sizes for unbalanced cases in parenthesis.

